 Print
PrintSubodh Mishra is Executive Director at Institutional Shareholder Services, Inc. This post is based on an ISS publication by Mr. Mishra.
Following the implementation of mandated advisory shareholder votes on executive compensation under the Dodd-Frank Act of 2010, investors have regular opportunities to opine on executive pay programs. Investor feedback on the issue of pay-for-performance has indicated a preference for a focus on long-term alignment, board decision-making, and pay relative both to market peers and company performance. As a result, ISS’ approach to evaluating pay-for-performance comprises an initial quantitative assessment and, as appropriate, an in-depth qualitative review to determine either the likely cause of a perceived long-term disconnect between pay and performance, or factors that mitigate the initial assessment.
The initial quantitative screens are designed to identify outlier companies that have demonstrated significant misalignment between CEO pay and company performance over time. The screens measure alignment on both a relative and absolute basis, and over multiple time horizons. The screening process applies to constituents of the Russell 3000E Index, a collection of the largest 3,500 (approximate) equity securities traded on U.S. stock exchanges. Beginning with annual meetings on or after Feb. 1, 2018, the quantitative screen includes a new financial performance assessment that measures on a long-term basis the relative alignment between CEO pay and key financial metrics. Before this 2018 model change, the financial performance assessment was limited to ISS’ qualitative evaluation.
ISS reviews the Compensation Discussion and Analysis (CD&A) section of all companies’ proxy statements and highlights noteworthy issues to investors regardless of the quantitative concern level. This qualitative evaluation, as well as any in-depth qualitative evaluation subsequent to the quantitative screens, is the most important part of the analysis and subsequent vote recommendation. Responsiveness following a low say-on-pay vote or the identification of problematic incentive designs, such as multi-year guaranteed payments, discretionary pay components, inappropriate perquisites (including tax gross-ups), or lack of rigorous goals, are addressed in the qualitative analysis and may result in a negative recommendation despite a “Low” quantitative concern. For additional information, see ISS’ U.S. Compensation Policies FAQ.
Following an elevated concern level under the quantitative screens, a subsequent in-depth qualitative assessment is designed to uncover mitigating factors or potential contributors to the perceived misalignment.
Quantitative Pay-For-Performance Evaluation
Broadly speaking, ISS has three main goals in developing the pay-for-performance methodology:
- Measure alignment over multiple time horizons. Business cycles and compensation plans’ performance cycles span multiple years. An assessment of alignment between shareholders and executives should accordingly see pay across timeframes that approach the length of performance and business cycles.
- Use multiple measures to assess alignment. The pay-for-performance evaluations are based on multiple measures, each of which assesses a company’s pay-for-performance alignment from a distinct perspective.
- Provide robust and standardized information about pay-for-performance concerns to investors and issuers. The evaluation is designed to quantify the degree of alignment between pay and performance, and provide results that can be compared between companies and across multiple years.
ISS’ quantitative pay-for-performance screen uses four measures of alignment between executive pay and company performance: three relative measures where a company’s CEO pay magnitude and the degree of pay-for-performance alignment are evaluated in reference to a group of comparable companies, and one absolute measure, where alignment is evaluated independently of other companies’ performance. The four measures, which are discussed in greater detail below, are:
- Relative Degree of Alignment (RDA). This relative measure compares the percentile ranks of a company’s CEO pay and TSR performance, relative to an ISS-developed comparison group, over the prior three-year period.
- Multiple of Median (MOM). This relative measure expresses the prior year’s CEO pay as a multiple of the median CEO pay of its comparison group for the most recently available annual period.
- Pay-TSR Alignment (PTA). This absolute measure compares the trends of the CEO’s annual pay and the change in the value of an investment in the company over the prior five-year period.
- Financial Performance Assessment (FPA). This relative measure compares the percentile ranks of a company’s CEO pay and financial performance across three or four financial metrics, relative to an ISS-developed comparison group, over the prior three-year period.
The following table summarizes the measurement periods, and inputs, for each measure:
| Measure | Absolute or Relative | Scope | Inputs |
|---|---|---|---|
| RDA | Relative | 3 years | CEO Pay & TSR |
| MOM | Relative | 1 year | CEO Pay |
| PTA | Absolute | 5 years | CEO Pay & TSR |
| FPA | Relative | 3 years | CEO Pay & Financials |
What We Measure
Executive Pay. Per SEC disclosure requirements, each annual meeting proxy statement includes an array of pay data, with a three-year look-back, for the five highest-paid executives including the CEO and CFO. The centerpiece of these disclosures is the Summary Compensation Table, which enumerates the key elements found in typical top executive compensation packages, including cash, indirect pay, and equity grants:
- Salary
- Bonus
- Nonequity Incentive Plan Compensation
- Stock Awards (grant date value)
- Stock Option Awards (grant date value)
- Annual Change in Pension Value/Nonqualified Deferred Compensation Earnings (above market rate)
- All Other Compensation
Other tables provide, among other details, summaries of equity- and nonequity-based grants in the last fiscal year, unexercised/unvested equity-based awards, and the realized gains of vested and exercised grants.
However, the Summary Compensation Table presents the most comprehensive picture of each named executive officer’s total planned and earned compensation for the year—specifically, the pay and pay opportunities that the compensation committee and board determined they ought to receive. It is those decisions that investors generally wish to monitor and evaluate, since their aim is to ensure that executives will be paid fairly, but not overpaid, for the performance they ultimately deliver and sustain. ISS focuses on the CEO’s pay because that package sets the compensation pace at most companies, and the compensation committee and board are most directly involved in and accountable for the decisions that generate the CEO’s pay.
In evaluating pay and performance alignment, ISS’ quantitative analysis focuses on CEO Total Compensation primarily as reflected in the Summary Compensation Table, although ISS utilizes a standard set of assumptions to value equity-based grants. All elements, including the Annual Change in Pension/Deferred Compensation Interest (not generally considered “direct” pay) are taken into account, since companies that do not provide components such as supplemental pensions and nonqualified deferral plans may compensate executives by making larger equity grants; thus, all elements are considered to help ensure equitable comparisons.
Company Performance. There are numerous ways to measure corporate performance, and key metrics may vary considerably from industry to industry and from company to company depending on the particular business strategy at any given time. Investors expect that incentive plan metrics will stem from that strategy and be designed to motivate the behavior and executive decisions that will lead to its successful execution.
However, one key measure for investors in the context of a long-term pay-for-performance evaluation is total shareholder return (TSR). ISS does not advocate that companies use TSR (or any particular metric) as the metric utilized in incentive pay programs. On the contrary, shareholders may prefer that incentive awards be tied to the company’s short- and long-term business goals. If the business strategy is sound and well-executed, the expectation is that it will create value for shareowners over time, as reflected in long-term total shareholder returns. For this reason, TSR, which is objective and transparent, is the primary metric ISS utilizes in evaluating pay and performance alignment.
In addition to TSR, ISS’ quantitative screen also analyzes long-term financial performance across key metrics as part of the Financial Performance Assessment (FPA). The FPA generally utilizes four metrics, with metric selections and weightings depending on the company’s industry (more details are provided below). The selection or weighting of any metric should not be interpreted as ISS’ suggestion that a particular metric—or combination of metrics—should be used to form a company’s compensation program. Rather, these metrics serve as a guide for ISS to assess long-term alignment between pay and a broader view of key financial performance. Nevertheless, TSR will remain the most impactful performance measure for the purposes of the pay-for-performance quantitative screen.
Measures of Relative Alignment
Relative Degree of Alignment (RDA)
This relative measure seeks to determine if the pay opportunity delivered to the CEO is commensurate with the performance achieved by shareholders, relative to a comparable group of companies (for more information on ISS’ peer selection methodology, see ISS’ U.S. Peer Group Selection FAQ). RDA compares the percentile ranks of a company’s CEO pay and TSR performance, relative to a comparison group of 12-24 companies selected by ISS on the basis of size, industry, market capitalization, and other factors, generally measured over a three-year period. An abbreviated two-year measurement period will be used in cases where three complete years of pay or TSR data is not available; in these instances, a two-year measurement period will be used for both pay and performance. If at least two years of data is unavailable, this measure will not be run.
To determine this measure, the subject company’s percentile ranks are calculated for three-year average pay and for annualized three-year TSR performance. The Relative Degree of Alignment is equal to the difference between the ranks: the performance rank minus the pay rank. The table below illustrates how the factors combine to determine the final measure—in this case, the relative degree of alignment is -27.
| Performance | Pay | Difference | |
|---|---|---|---|
| 3-year percentile rank | 32 | 59 | -27 |
Values for the Relative Degree of Alignment measure range between -100 and +100, with -100 representing high pay for low performance (i.e., 100th percentile pay combined with 0th percentile performance), zero representing a high degree of alignment (the pay rank is equal to the performance rank), and positive values representing high performance for low pay. Information on back testing is available in ISS’ white paper titled Evaluating Pay for Performance Alignment. Three-year average pay for the subject company and each peer company is based on the most recently disclosed three years of pay data available in the ExecComp Analytics database for that company.
Because of the sensitivity of TSR to overall market performance, annualized TSR performance for all companies (subject company and peer companies) will be measured for the same period: that is, the three-year period ending closest to the fiscal-year end of the subject company. Beginning with meetings on or after Feb. 1, 2018, ISS will also smooth the TSR calculation by averaging the daily closing prices for the beginning and end months of the TSR measurement period. The impact of dividends and stock splits occurring during the averaging period will be factored into the calculation of TSR. Before this change, TSR was measured from point-to-point on the beginning day and end day of the measurement period.
To illustrate the 2018 TSR calculation: if a company’s fiscal year ends on November 29, 2017, then for the subject company and its peers, TSRs will be measured by averaging the daily closing prices of the end month, November 2017, and the beginning month, November 2014.
Multiple of Median (MOM)
This relative measure identifies instances where CEO pay magnitude is significantly higher than amounts typical for its comparison group, independent of company performance.
Calculating is straightforward: the company’s one-year CEO pay is divided by the median pay for the comparison group. (For more information on ISS’ peer selection methodology, see ISS’ U.S. Peer Group Selection FAQ.)
Values can therefore range from zero (if the subject company reported no compensation in the most recent fiscal year) to any positive value, with no upper limit. A MOM value of 1.00 indicates that CEO pay in the last fiscal year is equivalent to the peer median.
Financial Performance Assessment (FPA)
This relative measure of alignment between CEO pay and company financial performance was first introduced as part of the pay-for-performance qualitative evaluation in 2017. As of 2018, the FPA measure has been added to the quantitative pay-for-performance screen and applied as a secondary measure after the traditional three screens (Multiple of Median, Relative Degree of Alignment, and Pay-TSR Alignment) have been calculated.
The FPA compares the company’s financial and operational performance over the long term versus the ISS peer group. The FPA utilizes three or four financial metrics, which are selected from the following, depending on the company’s industry:
- Return on invested capital (ROIC)
- Return on assets (ROA)
- Return on equity (ROE)
- EBITDA growth
- Cash flow (from operations) growth
The metric selections and weightings vary by four-digit GICS industry group, and not all industries will use all metrics. The metric selections and weightings were developed using a back-tested analysis of historical financial results and shareholder support for say-on-pay proposals (more detail in Appendix A of the complete publication, available here).
Financial performance is measured across a 3-year period (or a shortened 2-year period depending on trading history and data availability), and the subject company is ranked against its ISS-selected peers across each of the applicable metrics. Performance is measured using the 12 most recent trailing quarters (16 for growth metrics) as of ISS’ quarterly data download from Compustat3, so performance used in this evaluation may be different than annual results shown elsewhere in the research report (a minimum of 8 trailing quarters of valid data is required for the return metrics to be calculated, and 12 trailing quarters of valid data for growth metrics—this applies to the subject company as well as peer companies in the ISS Peer group, and a minimum of 12 peers with valid data is required to run the FPA test). The assessment uses reported, rather than adjusted, performance results in order to provide for a reasonable comparison across companies. The metric performance ranks are then combined into a weighted average performance rank.
The weighted average performance rank is compared to the subject company’s CEO pay rank, in a similar fashion to the operation of the Relative Degree of Alignment (RDA) test, creating a relative financial performance result. This may range from -100 to +100, with -100 representing high pay for low performance. A negative result indicates that the CEO pay rank is greater than the weighted average financial performance rank, and a positive result means that the CEO pay rank is below the weighted average financial performance rank.
Measure of Absolute Alignment
Pay-TSR Alignment (PTA)
This absolute measure is intended to identify whether shareholders’ and executives’ experiences, in terms of shareholder returns and granted pay, have followed the same long-term trend. PTA is not designed to measure the sensitivity of CEO pay to performance—whether pay and performance go up and down together on a year-over-year basis. Rather, it is a measure of long-term directional alignment.
At a high level, the measure is calculated as the difference between the slopes of weighted linear regressions for pay and for shareholder returns over a five-year period. This difference indicates the degree to which CEO pay has changed more or less rapidly than shareholder returns over that period. If at least five years of data is unavailable, this measure will not be run.
The regressions that calculate Pay and TSR trends are weighted least-squares regressions of pay and TSR against the independent (x) variable time. Because the timing of the measurements for pay and for TSR is different, however, the regressions are handled differently. The indexed TSR values represent “fence posts”—fiscal year-end markers—that connect the “fence rails” of pay delivered between those markers.
- For the pay regression, five values are measured, at times (years) 1, 2, 3, 4, and 5. The dependent (y) values for the pay regression are the total CEO compensation values for the five most recent fiscal years.
- For the TSR regression, six values are measured, at times (years) 0, 1, 2, 3, 4, and 5. The dependent (y) values for the TSR regression are determined by hypothetically “investing” $100 in the company on the day five years prior to the most recent fiscal year end, and measuring the value of that $100 investment on each of the subsequent five year fiscal year end dates, for a total of six indexed TSR values.
The following table traces a hypothetical company’s Pay and Indexed TSR values for the five-year period in question. The TSR % change column indicates the percentage return over the one-year period in question, for reference.
| Year (X) | Pay | Indexed TSR | TSR % change |
|---|---|---|---|
| 2012 (0) | – | 100 | – |
| 2013 (1) | 1,231 | 109 | 9.0% |
| 2014 (2) | 2,553 | 118 | 8.3% |
| 2015 (3) | 1,821 | 91 | -22.9% |
| 2016 (4) | 1,789 | 99 | 8.8% |
| 2017 (5) | 2,226 | 104 | 5.1% |
The regressions are weighted to place slightly more emphasis on recent experience. Because there are a different number of data points for the two regressions, pay and TSR each have their own weights calculated. The weights are constructed such that the geometric mean of the weights is equal to 1, and that the weight for a pay period is equal to the geometric mean of the weights for the TSR periods that “fencepost” it (e.g., the weight for pay period 2 is equal to the geometric mean of the weight for TSR periods 1 and 2). Finally, the weight for any period is equal to the weight for the next period times a decay factor (set to .85 for the ISS model), yielding weights as follows:
| Period 0 | Period 1 | Period 2 | Period 3 | Period 4 | Period 5 | |
|---|---|---|---|---|---|---|
| Indexed TSR weights | 0.6661 | 0.7837 | 0.9220 | 1.0847 | 1.2761 | 1.5012 |
| Pay weights | n/a | 0.7225 | 0.8500 | 1.0000 | 1.1765 | 1.3841 |
The indexed TSR calculation depends on a continuous series of TSR data. If TSR data for only the first period is missing, PTA will be calculated on the basis of 4 years of data, otherwise PTA will not be calculated. If pay data are missing for any one period, then that period carries zero weight for both pay and TSR in the calculation.
The slope of the weighted least-squares regression is calculated as follows, if Pi represents the pay or performance value for period i, Wi represents the corresponding weight for period i, and Xi is simply i:
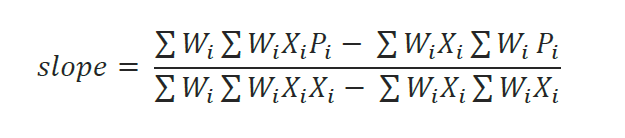
In order that the two slopes are comparable to one another, each must be normalized by dividing by their respective weighted-average values:
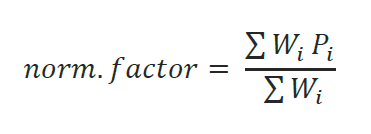
The normalized slopes are therefore analogous to a 5-year “trend rate” for pay and performance, weighted to reflect recent history. The final Pay-TSR Alignment measure is simply equal to the difference: performance slope minus the pay slope. Potential values for PTA are theoretically unbounded, but in practice they range from just over -100 percent to just over 100 percent.
Quantitative Screening Methodology
Philosophy. The three existing measures (RDA, MOM, and PTA) and the new FPA measure together provide an important signal for ISS’ initial quantitative evaluation of pay-for-performance alignment. ISS has developed a framework to determine whether the measures indicate the presence or absence of a pay-for-performance disconnect.
The philosophy of the framework is that if a pay-for-performance measure for a company lies within a range of typical values, then it has demonstrated some evidence of pay-for-performance alignment. If the company’s measure falls outside that range, a disconnect may exist.
The evaluative approach begins by identifying companies that are outliers. The approach is based on empirical observation of the distribution of the measures within the back-testing universe, and on the relative strength of the relationship of each measure to voting outcomes. Additionally, the methodology, where possible, avoids arbitrary threshold effects by using a continuous scoring approach. As a result, scores are additive—concerns raised for multiple measures can accumulate to provide evidence for a pay-for-performance disconnect.
Quantitative Concern Levels. As a result of the introduction of the FPA measure, ISS’ quantitative screen will now produce two concern results: (i) an “Initial Quantitative Concern” level and (ii) an “Overall Quantitative Concern” level. The Initial Quantitative Concern level is determined by the results of the three primary pay-for-performance measures: RDA, MOM, and PTA, which will continue to operate in the same manner. The “Overall Quantitative Concern” level reflects the final concern level for the quantitative screen, which may or may not have been impacted by the FPA results, as described below. The Overall Quantitative Concern will be the indicator for any pay-for-performance disconnect warranting an in-depth qualitative evaluation.
Sample of New Pay-for-Performance Screen Summary
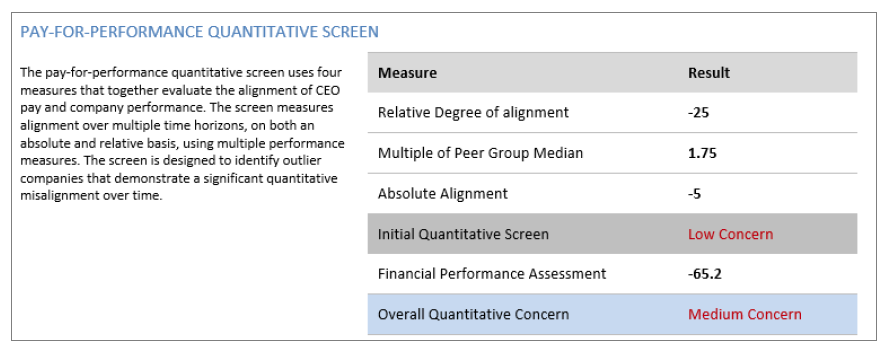
Most companies will not have their Overall Quantitative Concern level modified by the FPA result. The FPA may affect the Overall Quantitative Concern level only if a company has (i) a Medium concern result under the Initial Quantitative Screen, or (ii) a Low concern result under the Initial Quantitative Screen but which result borders the Medium concern threshold under any of the three initial measures (RDA, MOM or PTA).
If a company would have Low concern under the Initial Quantitative Screen, but the result is bordering the Medium concern threshold, a showing of relatively poor fundamental financial performance in the FPA may increase the Overall Quantitative Concern level to Medium (as shown in the above graphic). Conversely, if a company would have Medium concern under the Initial Quantitative Screen, a showing of relatively strong fundamental financial performance in the FPA may reduce the Overall Quantitative Concern level to Low. The determination of whether the FPA score is relatively poor or strong in this context takes into consideration the individual company’s index membership, GICS industry group, and Initial Quantitative Screen result.
The FPA result will not impact the Overall Quantitative Concern level for companies exhibiting a High concern level or a Low concern level with all three tests below the “Eligible For FPA Adjustment” threshold (see below) on the initial Quantitative Screen.
The pay-for-performance thresholds were first established based on back testing conducted in 2014 and are regularly reviewed and periodically updated. Information on back testing the three traditional quantitative screens is available in ISS’ white paper titled Evaluating Pay for Performance Alignment.
The table below shows the levels for each measure that indicate where a company would be considered to have a misalignment between pay and performance triggering a Medium or High concern. The “Eligible For FPA Adjustment” thresholds displayed below indicate RDA, MOM and PTA that are deemed to be bordering the Medium concern threshold—companies with results in that band will be eligible for their Overall Quantitative Concern to be impacted by the FPA score, as outlined above.
Quantitative Concern Thresholds: non-S&P 500
| Measure | Eligible for FPA Adjustment | Medium Concern | High Concern |
|---|---|---|---|
| Relative Degree of Alignment | -28.4 | -40 | -50 |
| Multiple of Median | 1.74x | 2.33x | 3.33x |
| Pay-TSR Alignment | -13% | -20% | -35% |
Beginning with meetings on or after Feb. 1, 2018, S&P 500 companies will have a distinct set of thresholds from other Russell 3000E companies for the Multiple of Median (MOM) test. The lower threshold reflects increasing investor scrutiny regarding the escalating quantum of CEO pay among large-cap companies.
Quantitative Concern Thresholds: S&P 500 only
| Measure | Eligible for FPA Adjustment | Medium Concern | High Concern |
|---|---|---|---|
| Relative Degree of Alignment | -28.4 | -40 | -50 |
| Multiple of Median | 1.64x | 2.00x | 3.33x |
| Pay-TSR Alignment | -13% | -20% | -35% |
The FPA presentation in ISS proxy research reports for 2018 will reflect the reduction in the number of potential metrics, and its incorporation into the quantitative screening methodology:
Sample of Financial Performance Assessment (FPA)

Qualitative Evaluation
An important step when pay and performance appear disconnected is to assess how various pay elements may be working to encourage, or to undermine, long-term value creation and alignment with shareholder interests. It is the outcome of this qualitative analysis that determines the vote recommendation for the say-on-pay proposal (or, in some cases, for the election of directors when there is no say-on-pay proposal on the ballot).
What We Assess
This second step in the pay-for-performance evaluation reviews the full picture of compensation decisions and practices at the company and may include consideration of some or all of the following factors (this is not intended to be a comprehensive list of all factors that may be considered):
Strength of performance-based compensation and rigor of performance goals. This key consideration includes a review of the ratio of performance-to-time-based equity awards as well as the overall ratio of performance-based compensation to fixed compensation, focusing particularly on the compensation committee’s most recent decision-making (which reflects its current direction).
A company that exhibits significant misalignment of pay opportunities and performance over time would be expected to strongly emphasize performance-based compensation (though not by simply increasing the size of the pay package in order to make it more performance-based). ISS will review both recent cash awards paid and long-term award opportunities intended to drive future performance, to evaluate their design and performance criteria. Time-based awards (including standard stock options and time-vesting stock awards) that are not granted based on the attainment of pre-set goals are not considered strongly performance-based in this
context. Shareholders would also expect such a company to fully disclose performance metrics and goals, which should be reasonably challenging in the context of its past performance and goals, guidance the company has provided to analysts, etc. If goals were set lower compared to the prior year’s goals or actual performance levels, the company should explain the reason for this and how that was considered in setting corresponding pay opportunities. ISS may also review goals from prior award cycles and the level at which those awards were earned or forfeited. Use of a single metric, or very similar metrics, in both of the short- and long-term incentive programs may indicate duplicative awards or suggest inappropriate focus on one aspect of business results at the expense of others. If the company uses non-GAAP metrics, adjustments should be clearly disclosed (along with compelling rationale if such adjustments are nonstandard and/or reflect factors within the control of management).
Financial/operational performance. ISS may consider a company’s financial and operational metric results (on a GAAP basis). In addition to the FPA measure introduced into the quantitative screen for 2018 annual meetings, ISS may also consider a company’s general financial performance (such year-over-year changes) in the qualitative review, which may give context to award opportunities and/or incentive payouts. For example, strong results in a performance metric may justify above-target payouts relating to that metric, despite poor TSR performance.
Realized and realizable pay. As noted above, the value of pay opportunities that depend on future stock prices and/or achievement of performance goals may not ultimately be delivered, and many investors believe that this should be a consideration in a pay-for-performance analysis. ISS has generally considered amounts of “realized” equity and performance grants, as appropriate, in the qualitative analysis. ISS also utilizes a defined calculation of “realizable pay” that may be considered in the qualitative review of S&P 1500 companies. The fact that realizable pay is lower than grant-date pay will not necessarily obviate other strong indications that a company’s compensation programs are not sufficiently tied to performance objectives designed to enhance shareholder value over time. However, in the absence of such indications, realizable pay that demonstrates a pay-for-performance philosophy will be a positive consideration. For information on how ISS calculates realizable pay and how it is evaluated in a qualitative review, see ISS’ U.S. Compensation Policies FAQ.
Peer group pay benchmarking practices. ISS closely examines a company’s disclosed pay benchmarking approach to determine whether it is a contributing factor to a pay-for-performance misalignment. For example, a preponderance of self-selected peers that are larger than the subject company may drive up compensation without regard to performance. Above-median pay benchmarking may have the same effect.
Executive transitions. In cases of executive transitions, ISS will consider compensation arrangements for both outgoing and incoming executives. Severance and termination-related equity award treatment as well as sign-on awards will be closely evaluated. The nature of the employment termination (i.e. voluntary, involuntary, retirement, etc.) and any apparent windfalls (or pay-for-failure risk) will also be considered. Further, while shareholders may welcome a new CEO in light of lagging performance, they may nevertheless be concerned when a board has been forced to pay dearly for outside talent but has failed to appropriately link the new CEO’s pay to expected performance improvement.
Special circumstances. ISS will also review unusual situations as a part of the qualitative analysis, such as a company’s responsiveness to receiving low support for the say-on-pay proposal in prior years or when a company is determined to have a history of poor pay practices. The qualitative analysis will consider any other special circumstances, such as unusual equity grant practices (e.g., bi- or triennial awards), the effects of grant timing, special one-time grants, etc. Given the limitations in disclosure and in order to provide a consistent comparison across all companies, the quantitative screen relies on information disclosed in the proxy pay tables for the year in review. However, if an elevated concern is raised, ISS will consider any special grant practices in the qualitative review, if this information is clearly disclosed. We note, however, that such circumstances do not automatically invalidate other aspects of the analysis, including the quantitative results, since that methodology’s long-term orientation is designed to smooth the impact of timing anomalies. Though the quantitative screen looks at CEO pay, any special or unusual grants made to other NEOs will also be reviewed. Companies should provide robust disclosure on the rationale and other relevant considerations for such circumstances.
Summary
ISS’ quantitative methodology combines two analytical perspectives—pay and performance relative to a comparison group of companies, and pay relative to absolute shareholder returns—to detect significant long-term disconnects. The comparison groups are based on a transparent methodology that reasonably accounts for company size, market cap, and general industry categorization—not for the purpose of benchmarking pay (or picking stocks) but to evaluate whether pay is generally commensurate with market peers and performance. More information on ISS’ peer group selection process, see ISS’ U.S. Peer Group Selection FAQ.
The qualitative evaluation ultimately determines whether pay-and-performance disconnects are being addressed with appropriately performance-based pay opportunities. The use of the financial performance assessment (FPA), and metrics in addition to TSR, further assists in determining if appropriate linkages exist between pay and company performance. While shareholders are not interested in micro-managing executive pay programs, they certainly have a stake in ensuring that compensation programs are effectively driving value creation.
The complete publication, including footnotes, is available here.
