 Print
PrintKosmas Papadopoulos is Managing Editor and Executive Director with ISS Analytics, the data intelligence arm of Institutional Shareholder Services, Inc., and John Roe is Head of ISS Analytics. This post is based on an ISS Analytics memorandum by Mr. Papadopoulos and Mr. Roe. Related research from the Program on Corporate Governance includes Paying for Long-Term Performance (discussed on the Forum here) and the book Pay without Performance: The Unfulfilled Promise of Executive Compensation, both by Lucian Bebchuk and Jesse Fried.
How much compensation does a CEO really end up with? It’s a tough question to answer—the summary compensation table is often cited as what the CEO is paid, but the ultimate value that an executive realized from those grants can differ significantly from the amounts disclosed.
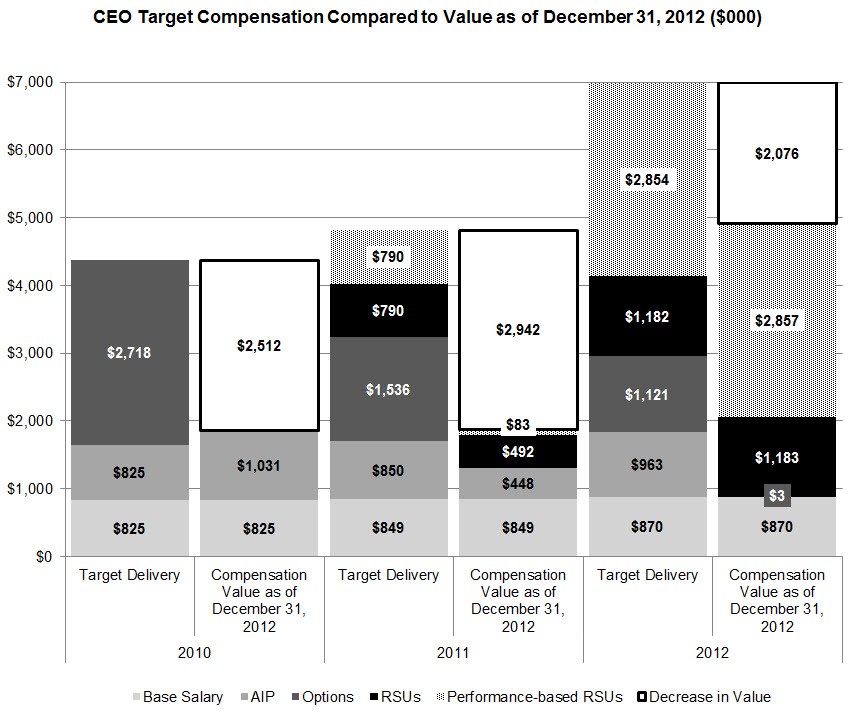
For years, companies have recognized this potential discrepancy; since even before the advent of say-on-pay, companies in perilous performance positions have turned to alternative measures of pay to demonstrate that executives have shared in the pain that investors feel in their portfolio values. These alternatives have included various forms of realizable and realized pay. An early example includes the disclosure below made at least six years ago, which still reflects the types of disclosures we see today:
Source: http://www.sec.gov/Archives/
Unfortunately, the market never arrived at a standard definition for realizable or realized pay. Different companies and different compensation consultants arrived at different ways of calculating and presenting these alternative measures, making it very difficult for investors to systematically use these disclosures in the analysis of pay and performance—much to the frustration of investors and companies alike.
However, using a standardized definition of realizable pay—such as the ISS definition—can help investors detect latent pay-for-performance issues, including:
- High performance pay leverage (where earn levels significantly exceed target grant levels);
- Step-over performance goals (where modest performance has led to large realizable pay figures); and
- Deficient pay program responsiveness (where pay program outcomes fail to reflect long-term investor outcomes).
Back to Basics: Different Compensation Definitions
Definitions of CEO compensation may vary, and each definition of pay may offer unique insights about a compensation program’s link to company performance. In this article, we review the concept of “realizable pay,” a measure of executive compensation that focuses on the value of compensation after the compensation is granted and before the compensation is fully realized. We argue that realizable pay has a unique capacity to highlight alignment or misalignment of pay and performance.
- Realizable pay focuses on the middle of the “compensation lifecycle,” allowing investors to see how an executive’s pay has changed relative to the target payout measured in grant-date pay.
- Calculations of realizable pay may vary significantly, resulting in widely different figures. The main differences focus on the method for valuing options and the timing of valuing performance-based and time-based awards.
- Realizable pay shows alignment with shareholder returns, and a disconnect between realizable pay and shareholder returns can help identify potential cases of pay-for-performance misalignment.
- Disproportionate increases in realizable pay relative to shareholder returns are likely to meet shareholder dissatisfaction in the form of lower say-on-pay support rates.
- Realizable pay can be a useful analytical tool, but it cannot replace a comprehensive pay-for-performance analysis.
What is Realizable Pay?
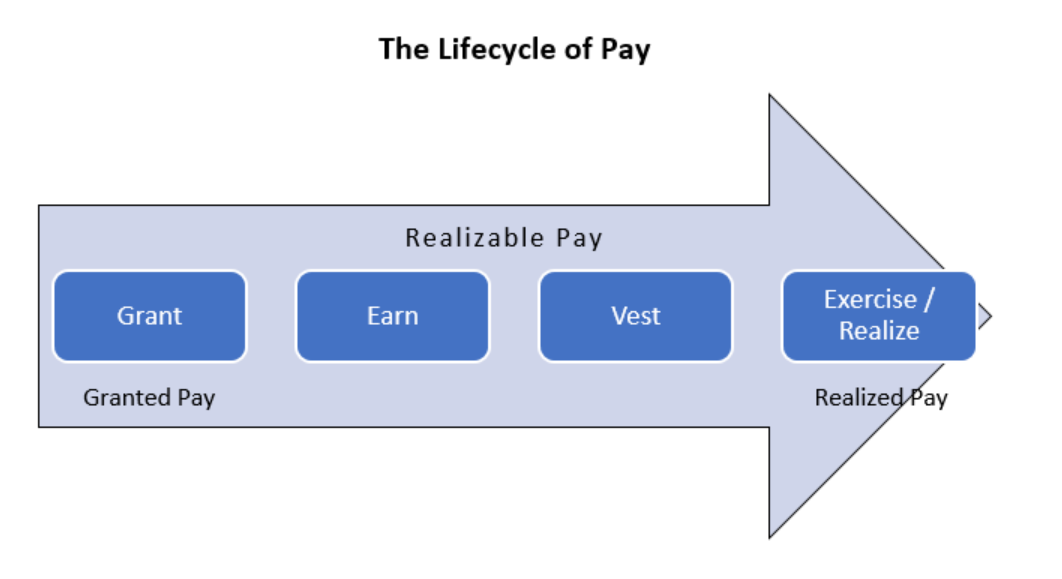
Most conventional executive compensation calculations focus on pay at the two ends of the compensation lifecycle: at the time pay is granted or at the time it has been exercised or realized. Grant-date compensation calculations focus on the intent of pay based on target performance, while realized pay calculations show actual compensation received during a period—often regardless of when that pay was granted. Realizable pay focuses on pay in the middle of the compensation lifecycle, and it looks at a combination of potential compensation to be realized for the remainder of the performance period and compensation realized up to a specific point in time. In addition, realizable pay neatly ties together grants and outcomes; items measured in realizable pay calculations always tie back to grants made within the same time period.
Realizable Pay Calculation Methodologies
There are many ways to calculate realizable pay, and differences in methodology can result in vastly different values.
ISS has developed a standardized methodology for calculating realizable pay using a three-year lookback period. Under this approach, earned cash and equity awards are valued based on actual payouts during the performance period, as disclosed by the company. Exercised options are valued based on intrinsic value at the date of exercise. Unearned and non-forfeited cash and equity awards are value at target, while unexercised options are valued using the Black Scholes model. Awards received during the period under review but granted prior are excluded. All forfeited equity awards and options are also excluded.
The chief factors that influence ISS’ realizable pay calculations are:
- Performance-based equity award payout levels: Realizable pay tracks the over- or under-achievement of performance goals set by the Board at the beginning of the performance cycle, leading to above- or below-target numbers of shares earned.
- Stock price movement: Equity awards—both time- and performance-based—are adjusted based on stock price appreciation/depreciation over the performance measurement period.
- Stock option valuation changes: Stock options can provide high leverage to performance; realizable pay tracks changes in stock option valuation across the performance period.
- Non-equity incentive earn levels: ISS’ companion measure to realizable pay, call granted pay, replaces the as-earned valued for non-equity incentives (as shown in the summary compensation table) with target-granted values (as shown in the grants of plan based awards table). Therefore, the outcomes of non-equity incentives flow through when comparing realizable pay to granted pay.
Alternative calculation methodologies adopted by companies and compensation consultants typically differ in two main areas: the valuation of options and when the value of performance- and time-based awards is recognized. The intrinsic value calculation for options subtracts the exercise price from the current stock price. This approach can yield dramatically different results compared to the Black Scholes pricing model, because it ignores the time value of the option. Underwater options would be valued at zero under the intrinsic value calculation. The Black Scholes model is more comprehensive in its approach and generally comes much closer to the true value of the option award, although it has been criticized for overvaluing option awards.
On the timing of when to recognize the value of performance- or time-based awards, opinions may differ on whether the awards should be valued when earned, when vested, or at the end of realizable pay measurement period.
The Ratio of Realizable Pay to Granted Pay
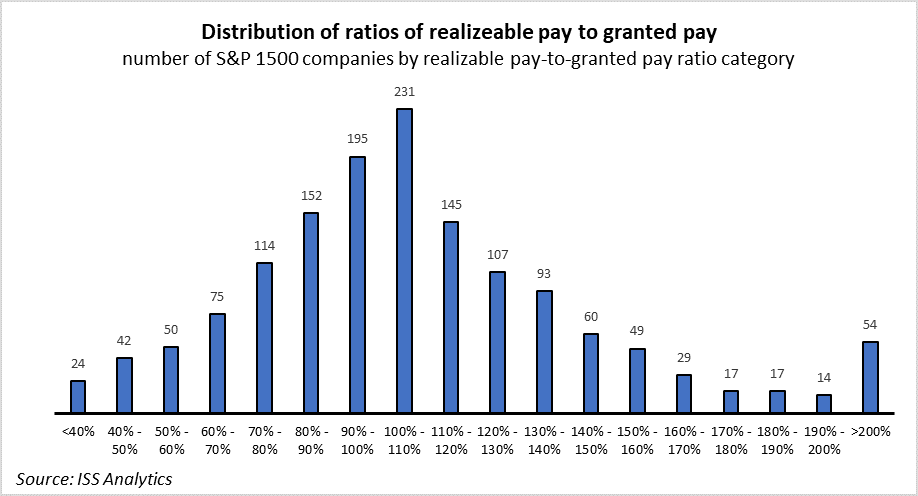
Comparing realizable pay to granted pay may serve as a helpful measure to assess a pay program’s alignment with performance as well as the pay program’s “leverage,” i.e., the degree to which actual payouts are disproportionally larger compared to performance achievements. Leverage in pay plan design can serve as a strong motivational factor. However, excessive leverage may lead to excessive payouts and potential a misalignment of incentives. Among the S&P 1500, the ratio of realizable pay to granted pay is distributed in a relatively normal distribution, with median realizable pay figures ranging between 100 percent and 110 percent of granted pay. Approximately 3.7 percent of companies under review have realizable pay figures that are more than double the granted pay levels.
Realizable Pay and Performance Alignment
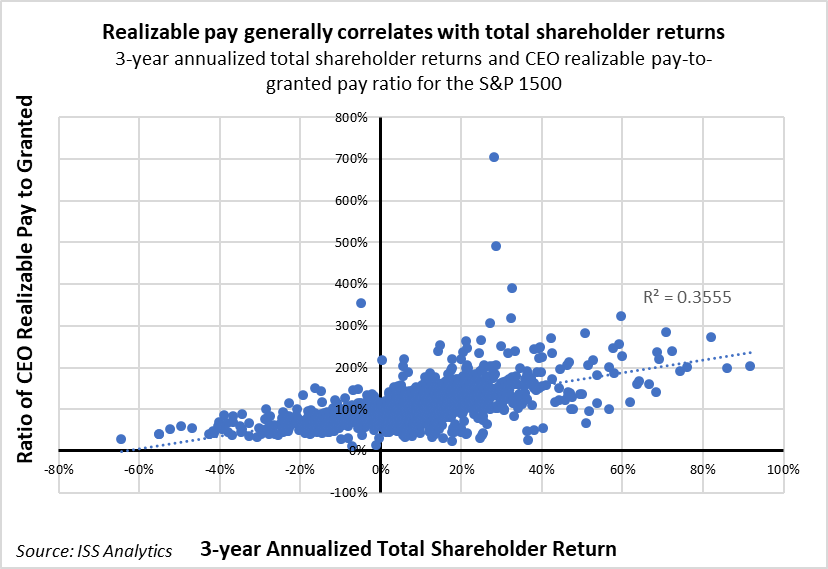
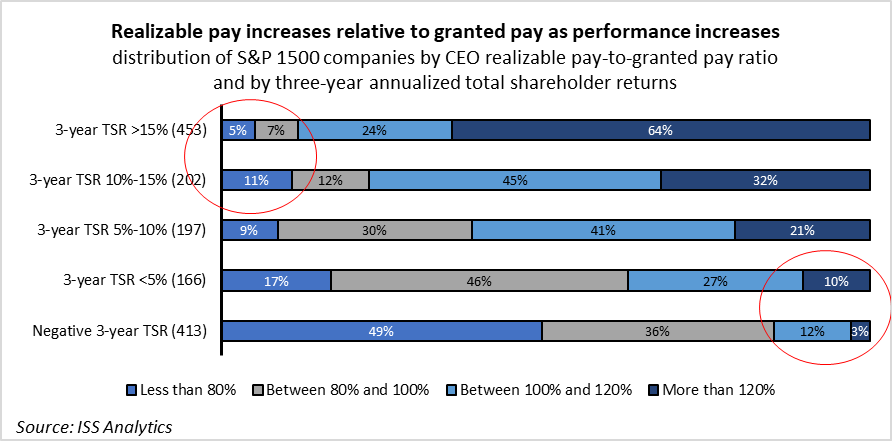
In our analysis of realizable pay, we find that the realizable pay of most CEOs is generally aligned with company performance. Based on our review of the S&P 1500, the ratio of realizable pay to granted pay appears to have an almost direct relationship with companies’ three-year annualized shareholder returns. And, of course, this makes sense—after all, realizable pay takes into account stock price movements.
While we identify a clear pattern, where realizable pay follows shareholder returns in an almost linear fashion, the use of realizable pay can prove helpful in identifying outliers, where low or negative returns correspond to realizable pay that is significantly higher than granted pay. Moreover, tracking realizable pay can help identify cases where executive compensation increases disproportionately to performance—despite good or even stellar shareholder returns—leading to excessive compensation packages.
For example, among the 413 CEOs of S&P 1500 companies that experienced negative three-year cumulative returns, 61 executives (15 percent) saw realizable pay figures increase relative to their granted pay (intended pay based on target performance). While these instances do not necessitate a pay-for-performance misalignment, they may include cases that warrant closer examination. At the same time, companies where realizable pay is lower to granted pay despite good performance may also be of interest, as those instances may raise retention concerns.
Realizable Pay and MSOP Vote Results
To identify whether realizable pay can serve as a good measure of pay-for-performance alignment, we linked realizable pay figures to the most recent say-on-pay vote results. In this instance, say-on-pay vote results serve as a litmus test for pay-for-performance alignment based on shareholders’ overall satisfaction with the compensation program. Our analysis shows that when realizable pay as a ratio of granted pay is disproportionately higher than the shareholder returns achieved by the company, support levels on say-on-pay proposals tend to be lower. First, we calculated the ratio of realizable pay to granted pay to measure the degree to which CEO pay increased relative to granted pay during the measurement period. Then, we divided this ratio to the indexed three-year cumulative shareholder return of the company, where the base value for each investment is 1. Therefore, a company with negative cumulative returns of 30 percent would have a value of 0.7, while a company with positive cumulative returns of 50 percent would have a value of 1.5. The combined ratio shows the extent to which pay increased more than performance. If a company’s realizable pay relative to granted pay increased more than the indexed cumulative performance, the combined ratio is greater than 1. Therefore, the higher the combined ratio, the greater the potential disconnect. The graph below shows that companies with higher combined ratios experienced lower support on their say-on-pay proposals. And while 91 percent of votes cast in favor may appear high, this support level is at the bottom quartile of say-on-pay vote results.

The Future of Realizable Pay
Looking ahead, several questions continue to surround realizable pay. The market does not appear to have agreed on standard definitions, and company disclosures are inconsistent and hard to use. At the same time, there are signs that the measure may be gaining traction with some large investors, as CalPERS recently announced the incorporation of realizable pay in its pay-for-performance evaluation analysis. If usage of realizable pay becomes more widespread, a common definition for the measure may become inevitable. As we argue above, companies and investors can gain significant insights when reviewing pay-for-performance alignment by using realizable pay. However, realizable pay can only serve as another resource in investors’ toolbox for analyzing compensation, and it cannot replace a full and comprehensive evaluation of compensation. ISS Research reports for S&P 1500 companies include realizable pay figures along with comparisons to granted pay.