 Print
PrintMichael Klausner is the Nancy and Charles Munger Professor of Business and Professor of Law at Stanford Law School; Michael Ohlrogge is Assistant Professor of Law at NYU School of Law; and Emily Ruan of Stanford University. This post is an update to their previous post on the Forum here.
About a year ago, we wrote a post on this blog, entitled A Sober Look at SPACs, which summarized an article we had written with the same title. Our research showed, among other things, that SPAC shares were highly diluted, that their post-merger performance was quite poor, and that sponsors’ returns were extraordinarily high. We have now updated that article here. In our update, we include a “Postscript” that responds to the most common criticism we received on our initial paper: that our data from January 2019 through June 2020 was outdated, that SPACs have changed (in a matter of months), and as a result “this time is different.” As Carmen Reinhart and Kenneth Rogoff have said in their book on financial crises, “More money has been lost because of these four words than at the point of a gun.”
In the months since we initially posted our research, the SPAC market experienced an extraordinary bubble. Much of what looked different during that time has since reversed itself. In this post, we summarize what has been different and what remains the same. On the whole, we conclude that this time is not different. SPACs remain highly diluted, and their returns remain poor.
1. The SPAC Bubble
Figure 1 shows the share prices of SPACs between the day of their IPO until the day before they announced a merger from January 2020 to November of 2021. Beginning in October of 2020, the month in which we posted our study, prices began surging to a peak of about $11.50 in February of 2021, and then fell back down to $10.00 in mid-2021. Price reactions to merger announcements were even more dramatic. Mean and median share prices the day after a merger announcement were $15.77 and $14.76, respectively, during Q4 2020 and Q1 2021. Historically, pre-merger shares typically traded at roughly $10.00, because they could be redeemed for about $10.00 when a merger was proposed, and post-merger prices typically fell below $10.00 because, on average, post-merger SPACs performed poorly. Share prices from late 2020 through early 2021 reflect one of two possibilities. One is that market participants believed that post-merger SPACs would perform spectacularly well. The other is that shareholders were relying on the “theory of the greater fool” associated with investment bubbles.
Figure 1: The SPAC Bubble
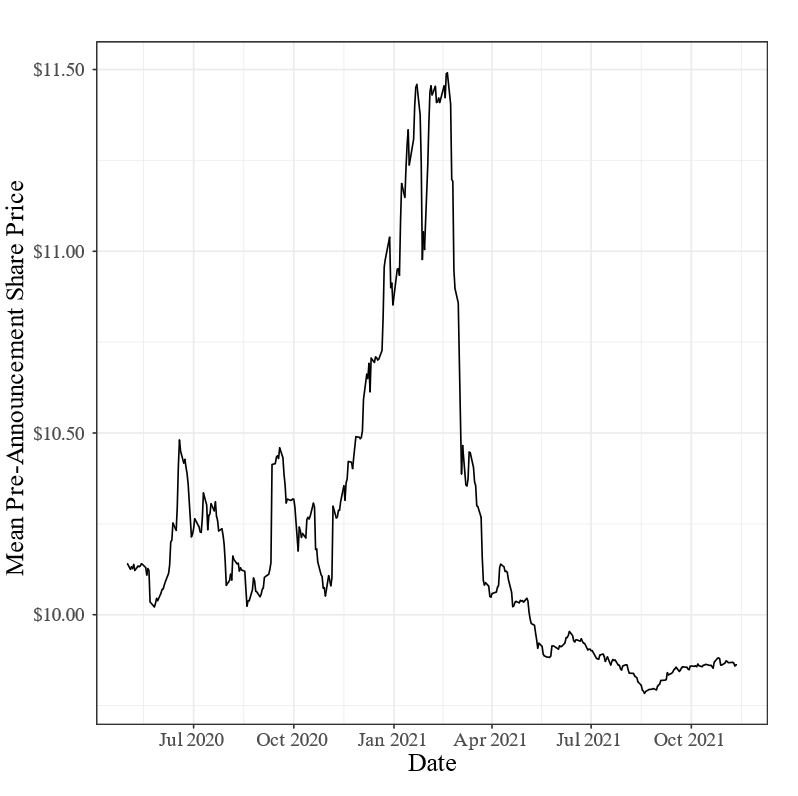
By the second quarter of 2021, SPACs’ pre-merger share prices fell back to roughly $10.00, and by the third quarter, we no longer saw the consistent price jumps in response to merger announcements. Furthermore, those SPACs that merged in Q4 2020 and Q1 2021 with share prices around $15.00 have now soured. As of December 2021, mean and median share prices for those SPACs have fallen to $9.01 and $7.09, respectively. If investors had redeemed their shares and invested the proceeds in a market index, they would now have roughly $12.35 in value. And, of course, had they sold their shares at their inflated prices during the bubble, they would have done even better.
2. What Is Not Different?
The structural elements of SPACs that are the source of their dilution and incentive misalignment remain essentially unchanged. Those elements are as follows:
- The essentially free shares a sponsor takes as its “promote”
- The free warrants issued to IPO investors
- An underwriting fee that does not adjust for redemptions
- Other high fees incurred at the time of the merger
During our study period, from January 2019 through June 2020, the cost of these features of the SPAC structure was, on average, a whopping $5.90 and, at the median, $4.30 for each pre-merger SPAC share. Those are the amounts extracted by SPAC sponsors, IPO investors, underwriters, and other advisors to SPACs – leaving SPAC shareholders with net cash per share of $4.10 on average and $5.70 at the median.
We found that, on average, there is a high correlation between the amount of cash in a SPAC as it enters into a merger and the value of the post-merger company. So, on average, we would expect a target to exchange $4.10 in value for each SPAC share it receives—or perhaps somewhat more if the target sees value in becoming a public company or in the continued engagement of a SPAC’s sponsor. Consistent with this expectation, we found that SPAC costs led to substantial losses to SPAC shareholders that did not redeem their shares. We found that SPACs whose sponsors were former Fortune 500 executives or were affiliated with investment funds with at least $1 billion in assets under management performed notably better than other SPACs. But even they did not perform well on the whole. In our updated version of the paper, we find that the returns to these SPAC mergers from 2019 and 2020, when measured as of November 2021, have gotten even worse since our initial online draft.
In the new postscript to the paper, we go beyond our original sample of SPACs and examine costs and performance of SPACs that merged between July 2020 and November 2021. As we discuss below, there have been some changes in SPACs that merged after the end of our study period in June 2020. But for those changes to turn SPACs from a losing proposition into a winning one for SPAC shareholders, they would have to be substantial—and persist into the post-bubble period.
3. What Is Different?
As is often true in times of financial bubbles, the SPAC bubble led commentators and SPAC promoters to exclaim that “this time is different.” What we repeatedly heard in response to our research is that SPACs may have been a bad investment for shareholders until June 2020—the end of our original study period –but no longer. These responses began the moment we posted our research in October 2020.
A few differences did, in fact, emerge during the SPAC bubble:
- Redemptions were lower than they had been during our study period
- SPACs were going public with fewer warrants
- PIPEs were larger and more common
- There were reportedly more high-quality sponsors
We evaluate the extent to which each of these differences is likely to improve returns to SPAC shareholders for SPACs that merged during the bubble and whether each has lasted since the SPAC bubble deflated.
a. Redemptions
Redemptions were very low during the SPAC bubble. From Q4 2020 to Q1 2021, mean and median redemptions were 22% and 0%, respectively (compared to 58% and 73% during our study period). Lower redemptions meant lower dilution and more net cash per share delivered in a merger. Based on our original analysis, this suggests that post-merger returns to shareholders of these SPACs will be higher, all else equal, than they have been for companies that merged during our study period.
Low redemptions, however, were a direct result of inflated pre-merger share prices during the bubble. If a SPAC’s share price prior to a merger is higher than the redemption price of $10 per share plus interest, then shareholders that choose to exit will do so by selling their shares rather than by redeeming them. Hence, even if pre-merger share prices are divorced from true value, those inflated prices can have an impact on the real amount of net cash underlying a SPAC share and on post-merger returns to shareholders.
Low redemptions, however, lasted only as long as inflated prices. The deflation of the SPAC bubble meant a return to redemption levels roughly similar to those experienced in the mergers during our study period. Between July 1, 2021, and November 1, 2021, mean and median SPAC redemptions were 57% and 68%, respectively. Redemptions at roughly this level are the historical norm for SPACs. Those during the bubble were a temporary aberration.
b. Warrants Per Unit
During the SPAC bubble, the number of warrants included in SPAC units declined on average. During our study period from January 2019 to June 2020, the mean number of warrants for SPAC IPOs was 0.5 per unit. During the peak of the bubble, in Q4 2020 and Q1 2021, that number declined to 0.33. Fewer warrants means less dilution of share value and higher post-merger shareholder returns.
Nearly all investors in SPAC IPOs either redeem or sell their shares rather than invest in a merger, and hence invest solely for the pre-merger return. During the period of the bubble, those investors presumably expected each warrant to be worth more, and each share to appreciate between the time of an IPO and a merger. They were therefore were willing to accept fewer warrants in the IPO. As the bubble deflated, however, the number of warrants in SPAC units reflated. SPAC IPOs from July through September of 2021 returned to an average of 0.5 warrants per unit. Free warrants thus remain the not-so-secret sauce in attracting IPO investors.
c. PIPEs
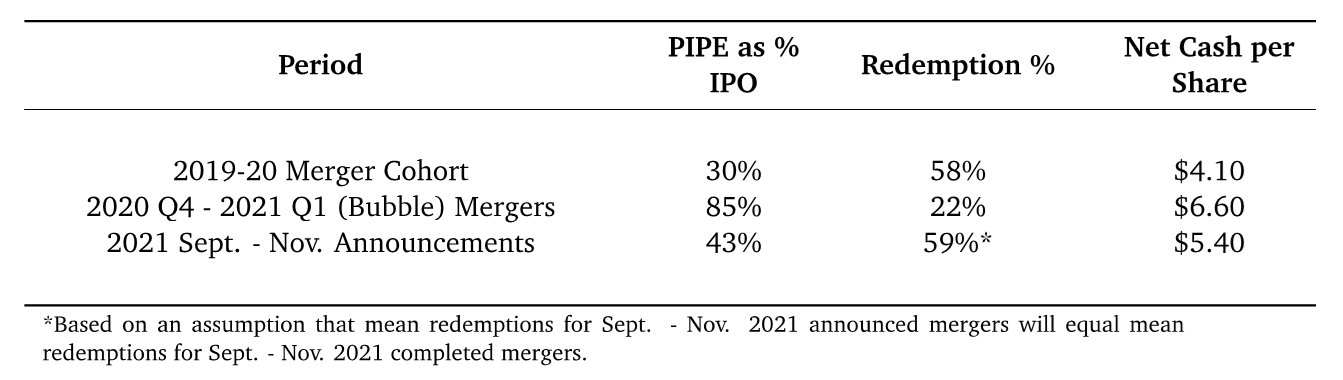
The use of private investments in public equity (“PIPEs”) increased during the SPAC bubble, as did the size of PIPEs. During our study period, from January 2019 to June 2020, the average PIPE equaled 30% of IPO proceeds. In the bubble period from Q4 2020 to Q1 2021, the average PIPE had grown to 85% of IPO proceeds This is an important difference. So long as PIPE investors pay a price per share that is greater than a SPAC’s net cash per share, they increase net cash per share at the time of a merger, which as we have said is correlated with higher post-merger returns to SPAC shareholders. Nonetheless, unless a PIPE is extraordinarily large, a SPAC will still deliver substantially less than $10.00 per share in net cash to a post-merger company.
The PIPE market has significantly cooled since the bubble deflated, with SPAC mergers announced from September through November 2021 having average PIPEs equal to 43% of IPO proceeds. That is still more PIPE money than was invested before the bubble, but it remains to be seen whether the supply of PIPE funds will persist. Unless this time is different with respect to long-term returns, those PIPE investments on average will be losing propositions.
d. Net Cash Per Share
We now use these data to approximate net cash per share for SPACs that have merged since our study period of January 2019 through June of 2020. As we have explained, our study found that net cash per share is highly correlated with post-merger share value. Thus, a SPAC with $6.00 per share in net cash will, on average, trade at a price one dollar higher than a SPAC with $5.00 per share in net cash. And over a period of a year following a merger, a SPAC with pre-merger net cash of $6.00 per share will, on average, fall to a price of roughly $6.00 (after adjusting for changes in the market). Of course, these are just averages. Some SPACS do better and some worse.
Some commentators have asserted that this dilution will somehow become irrelevant once a SPAC merges with a larger target. For example, in their post on this blog here, Ramey Layne and Brenda Lenahan of Vinson & Elkins stated: “As a practical matter, SPACs typically target business combination targets that are at least two to three times the size of the SPAC in order to mitigate the dilutive impact of the 20% founder shares.” This claim reflects a misunderstanding of how dilution and dissipation of cash affect SPAC shareholders. As we explain in our full paper, the size of the target company is irrelevant to what the SPAC shareholder will receive in exchange for a share with a cash value of $5. If there is $5 of net cash per share in a SPAC, that share would be expected to buy about $5 worth of target shares in a merger, regardless of whether the target is worth $100 million or $10 billion. There is no reason to believe that a larger company will be more inclined than a smaller company to exchange more than the value a SPAC share. This is borne out in our data.
Table 1 summarizes redemptions and PIPEs in the first two columns. (See our full article for an explanation of the data and calculations used here.) The third column contains our estimates of net cash per share based on those figures and estimates of fees paid in connection with mergers and sponsors’ cancelation of shares in their promote. Average pre-merger net cash per share increased from $4.10 during our study period to $6.60 during the bubble period and then dropped down to $5.40 among deals announced from September through November. The September through November figure is higher than the pre-bubble figure, but still substantially less than the $10 per share that SPACs purport to be worth in their mergers, and that shareholders forgo in choosing not to redeem their shares. Based on the correlation we have found between pre-merger net cash per share and post-merger share prices, the implication of Table 1 is that return to mergers that occurred after our study period will continue to be poor.
Table 1: Mean SPAC Dilution—Post-Study-Period Changes
e. Sponsor Quality
Commentators have stated that more SPACs today are sponsored by high quality sponsors than was true in the past. If high-quality sponsors, in fact, now account for a larger fraction of SPACs than they did in our study—a claim we have not investigated—then mean and median returns to SPAC shareholders could well be higher than they were for SPACs in our study. But our findings on returns to SPACs with high-quality sponsors do not suggest that those SPACs are good investments—only that they are better than investments in SPACs with non-high-quality sponsors. On a market-adjusted basis, even high-quality sponsors performed poorly on average.
4. Returns to Mergers Since Our Study Period
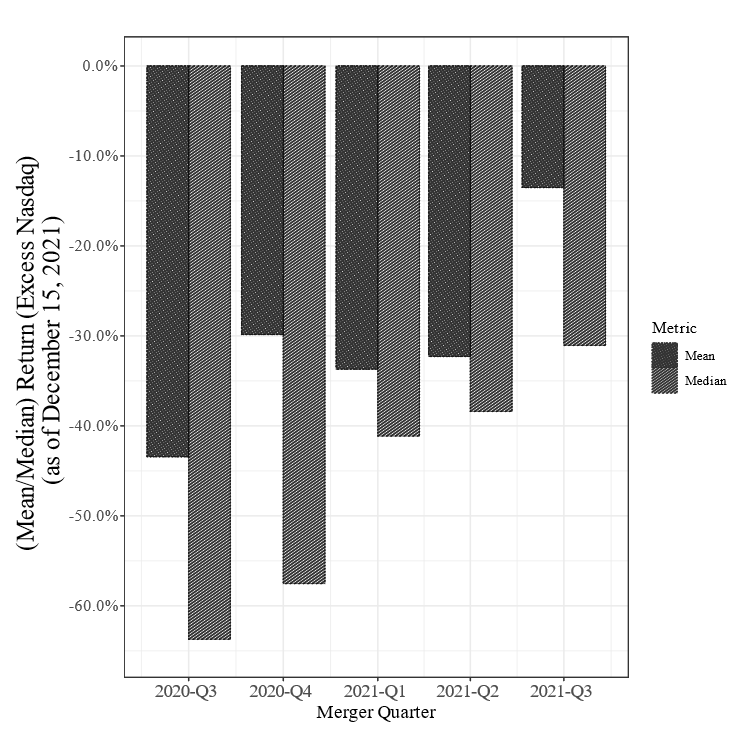
Figure 2 shows quarterly post-merger market-adjusted returns since the end of our study period in June 2020—the period of the bubble and the period since the bubble. We measure returns from the redemption price $10.00. The returns to mergers in the past year and a quarter have been quite poor. If we were to measure returns based on the market price at the time of a merger, returns to shareholders that bought shares at inflated prices during the bubble would be worse. It appears as though returns are better for more recent mergers than for those earlier in this period. But, as we report in our original study, SPACs’ post-merger returns tend to fall over the years following a merger. So, one should not read too much into this apparent trend.
Figure 2: Post-Merger Returns (Excess Nasdaq) for SPACs After our Study Period
In sum, the core problematic features of SPACs remain. Most of what appeared to be different were transitory bubble-related phenomena. The advent of large PIPEs during the bubble persist to a degree today, so dilution is less severe than during our study period. In addition, there may be more high-quality sponsors. Nonetheless, our analysis implies that these SPACs will continue to perform poorly, and the returns to SPACs that have merged over the past year and quarter have borne that out.
In short, this time has not been significantly different.
