 Print
PrintMatteo Tonello is Managing Director of ESG Research at The Conference Board ESG Center in New York. This post is based on CEO and Executive Compensation Practices in the Russell 3000 and S&P 500: Live Dashboard, a live online dashboard published by The Conference Board and ESG data analytics firm ESGAUGE, in collaboration with compensation consulting firm FW Cook. Related research from the Program on Corporate Governance includes The Perils and Questionable Promise of ESG-Based Compensation (discussed on the Forum here) by Lucian A. Bebchuk and Roberto Tallarita; Paying for Long-Term Performance (discussed on the Forum here) by Lucian A, Bebchuk and Jesse M. Fried; and Share Repurchases, Equity Issuances, and the Optimal Design of Executive Pay (discussed on the Forum here) by Jesse M. Fried.
Companies have crossed the Rubicon in integrating environmental, social & governance (ESG) performance into their executive incentive plans. With three-quarters of S&P 500 index companies embedding some type of ESG metric into their leadership compensation policies, the practice is now deeply ingrained. But there is an opportunity to move beyond generic goals and tailor ESG performance measures in a way that contributes to competitive advantage and long-term growth.
The Conference Board and ESGAUGE conducted a thorough analysis of executive incentive plans described in 2023 proxy statements, and the following are our key findings and insights on the use of ESG performance metrics.
Prevalence of ESG Performance Metrics in Executive Incentive Plans
More companies are integrating ESG performance metrics into the incentive plans for their CEO and senior executives. According to our 2023 proxy statement analysis, 75.8% of S&P 500 companies do so, compared to 66.5% in 2021. ESG metrics applicable to CEOs often also apply to other senior executives; in some cases, however, metrics for other executives may focus on stakeholder engagement within their functional areas, such as employee satisfaction for HR executives or customer relations for chief marketing officers.
The analysis of the broader Russell 3000 index shows a direct correlation between company size and the practice of integrating ESG performance metrics in executive incentive plans: in 2023, only 23.8% of companies with annual revenue under $100 million reported using ESG performance metrics, but the percentage grows to 83.6% among companies with annual revenue of $50 billion and over.
ESG performance metrics are very common in Russell 3000 companies in the utilities (89.1%) and energy (72.7%) sectors, but less so in information technology (28.3%), consumer staples (33.3%), and communication services (35.7%).
Incentive plan types
As the rate of adoption of ESG performance metrics increases, companies have started to also use them in long-term incentive plans. Most companies that use ESG performance metrics in their executive compensation design integrate such metrics into their annual incentive plans only (85.7% of the S&P 500 ESG performance metric users and 89.5% of Russell 3000 users in 2023).
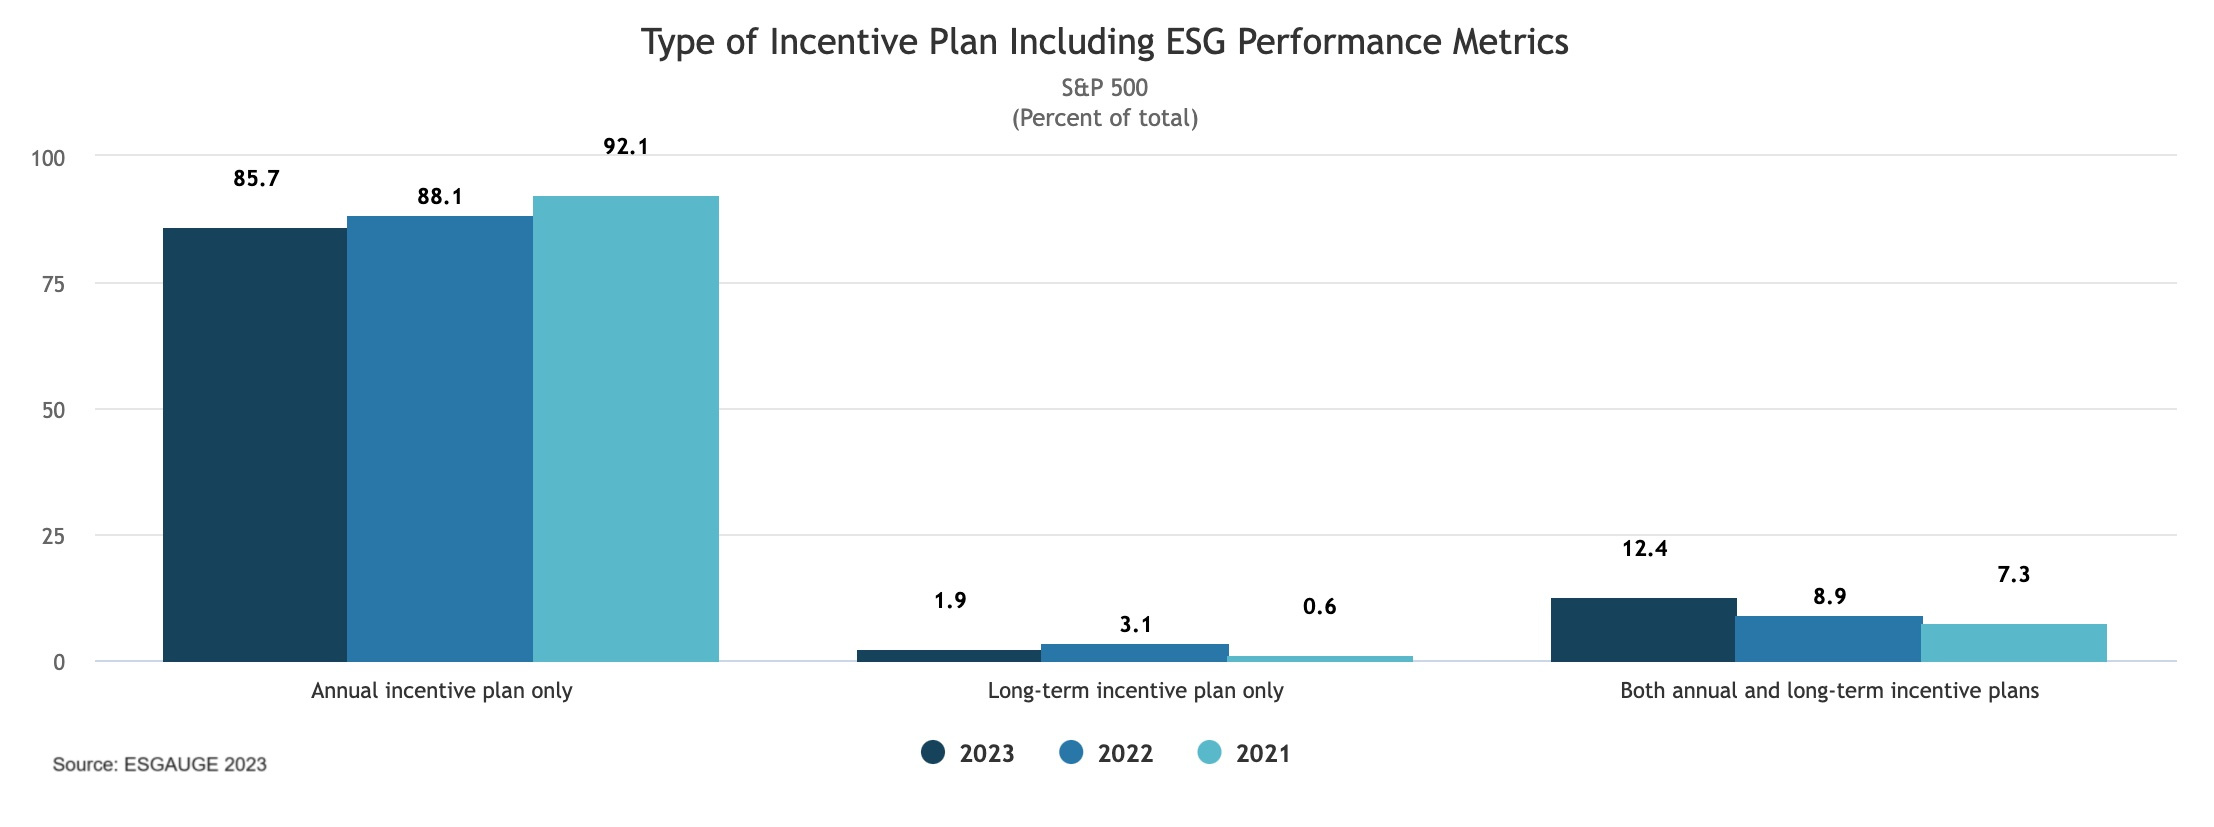
The percentage of companies that integrate ESG performance metrics in both their annual incentive plan (AIP) and their long-term incentive (LTI) plan, however, has been growing in the last couple of years. In the S&P 500, the percentage has grown from 7.3% in 2021 to 12.4% in 2023. As compensation committee members and compensation consultants confirmed to us,[1] this is an indication that companies are becoming more knowledgeable about the way these metrics work and increasingly comfortable about including them in more complex, longer-term plans.
Russell 3000 companies in the utilities and materials sectors report the highest percentage of ESG performance metric users that integrate such metrics into both annual and LTI plans (38.6% and 13.2%, respectively).
ESG Performance Metric Integration Types
Our analysis distinguishes three types of use of ESG performance metrics:
- The discrete, weighted metric, where a specific ESG metric comes with a designated target and weighting (e.g., 15% of the plan is tied to a carbon footprint reduction target and 10% is tied to a certain customer satisfaction rate).
- The strategic scorecard, where a certain percentage of the incentive plan is altogether tied to a bundle of two or more metrics, which may be ESG only or a combination of ESG and financial metrics, and which may or may not be weighted (e.g., 15% of the plan is tied to a scorecard of new strategic initiatives that may span quantified environmental performance targets as well as a more discretionary assessment of the progress made in the introduction of cybersecurity measures and in R&D investment increases).
- The discretionary metric, where the compensation committee retains ample discretion in an individual performance assessment that includes ESG achievements and that may impact the final payout (e.g., the CEO restructured the HR department and oversaw the development by a newly hired CHRO of a brand-new program to improve employee morale and strengthen corporate culture).
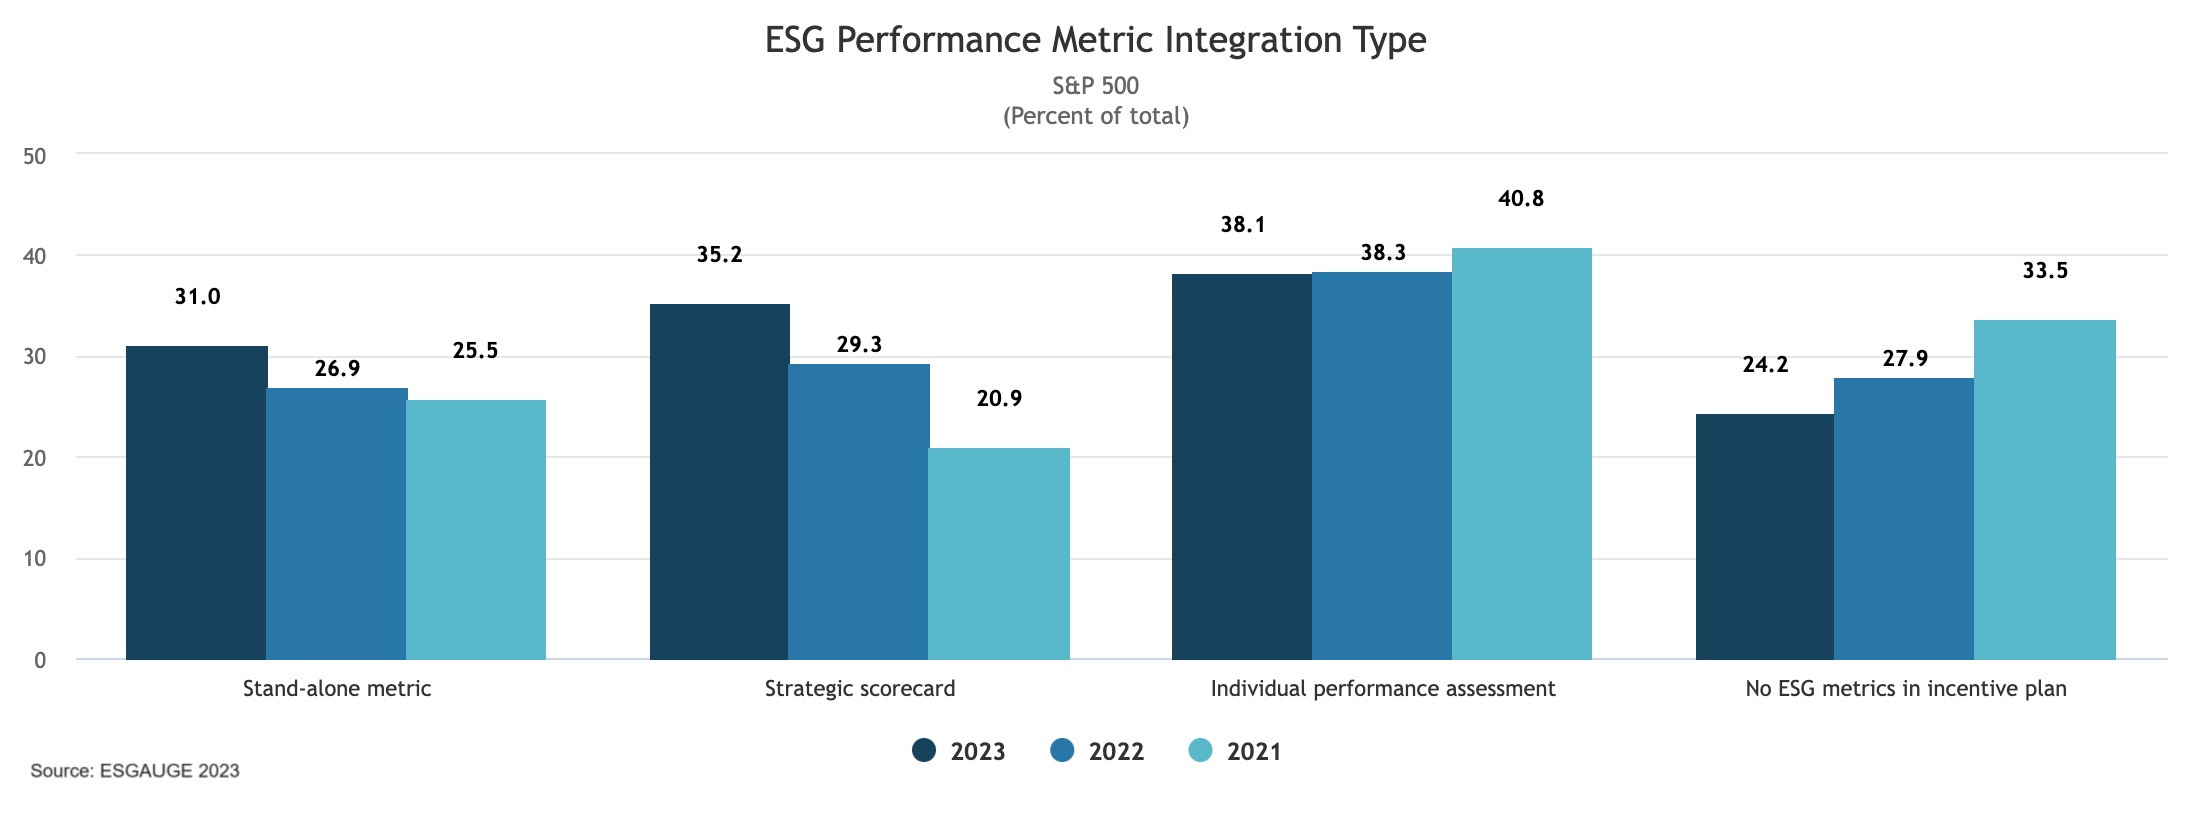
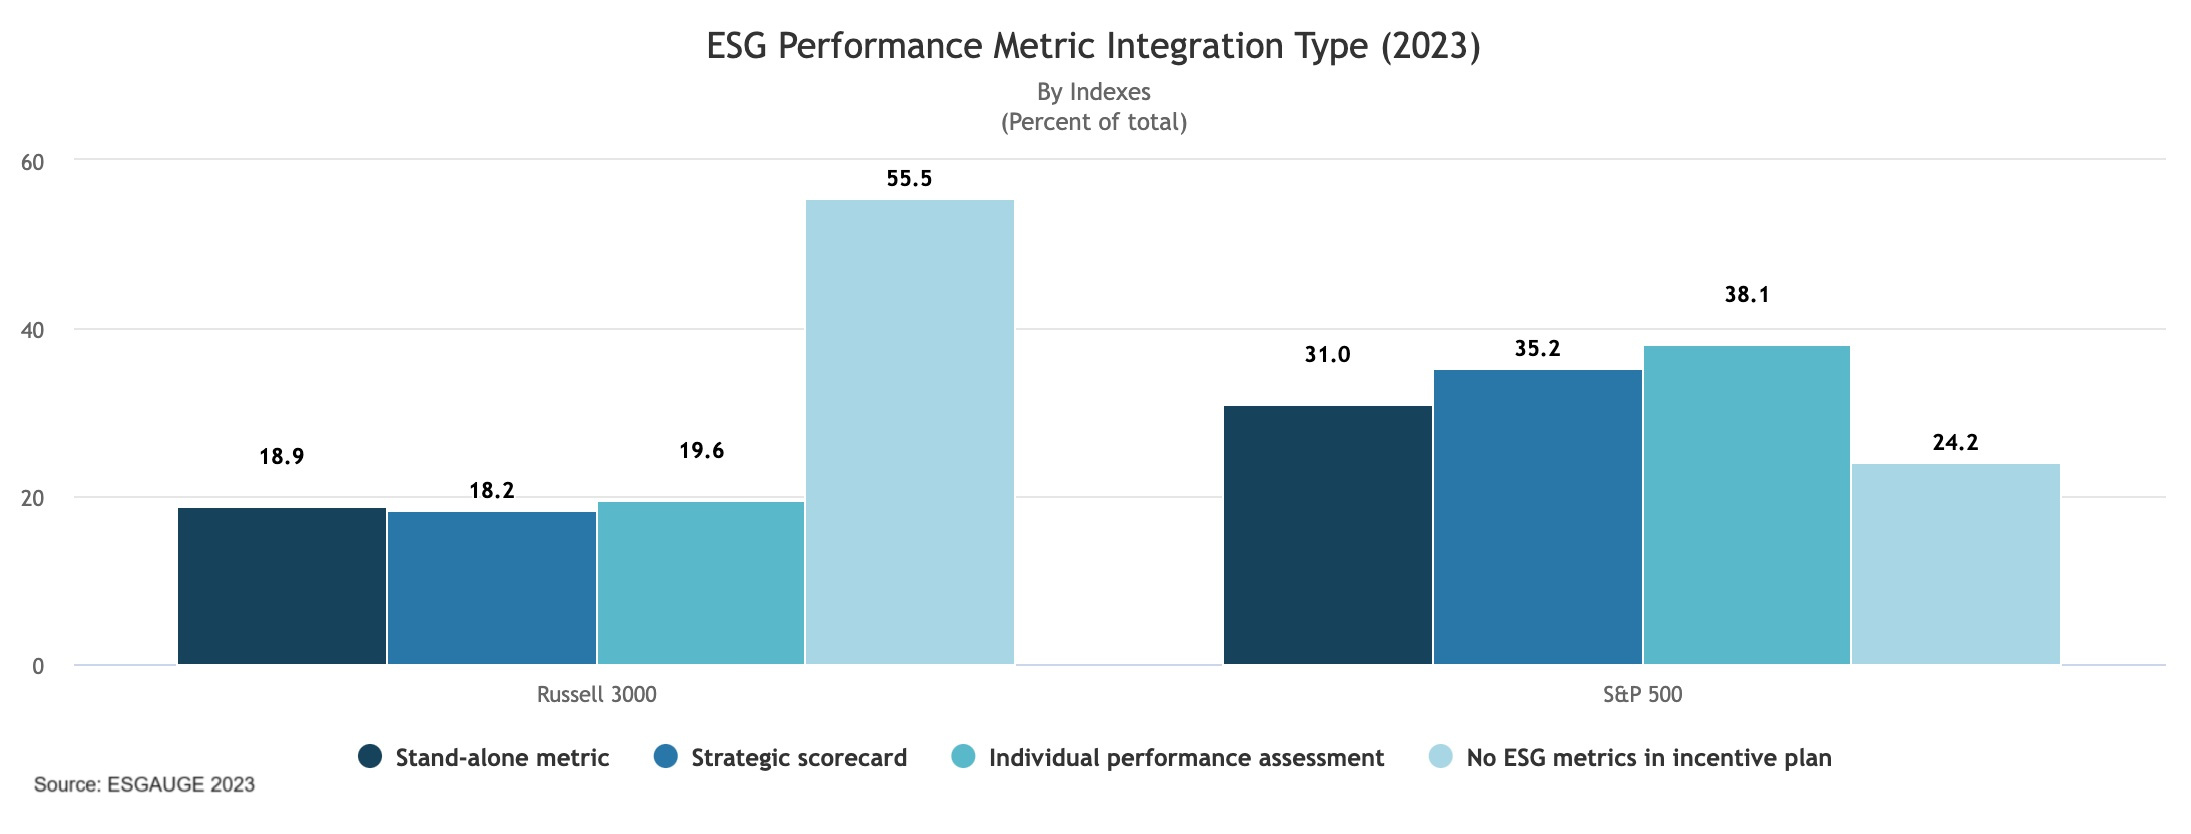
Compensation committees are becoming accustomed to setting more precise ESG- related targets and to conducting nondiscretionary forms of assessment of ESG performance. In the last couple of years alone, the use of stand-alone ESG metrics in the S&P 500 has increased from 25.5% to 31% of cases, while the prevalence of strategic scorecards inclusive of one or more ESG metrics has grown from 20.9% to 35.2%. These numbers are twice as high as those found in the broader Russell 3000 index.
The analysis of the broader Russell 3000 index tells us that the prevalence of discrete, weighted (stand-alone) metrics is directly correlated to the size of the company: only 10.6% of companies with annual revenue under $100 million reported this type of ESG performance metric use in incentive plans in 2023 proxy statements, compared to 39.3% of companies with annual revenue of $50 billion and over. This reflects a theme throughout the data: large companies, perhaps because of the greater resources they can devote to collecting and analyzing ESG data, are on the leading edge of the use of ESG performance measures in terms of the specificity of the metrics and the type of plan.

Significant differences can also be observed across sectors, with stand-alone, discrete metrics used by some 76.6% of utilities companies and 55.3% of energy companies in the Russell 3000, compared to only 12.9% of financials, 14.5% of real estate, and 12.4% of information technology companies. The integration of ESG into more complex strategic scorecards has increased from 19.4% in 2021 to 34.4% in 2023 among utilities and from 31.8% to 36.4% among energy companies.
ESG modifiers
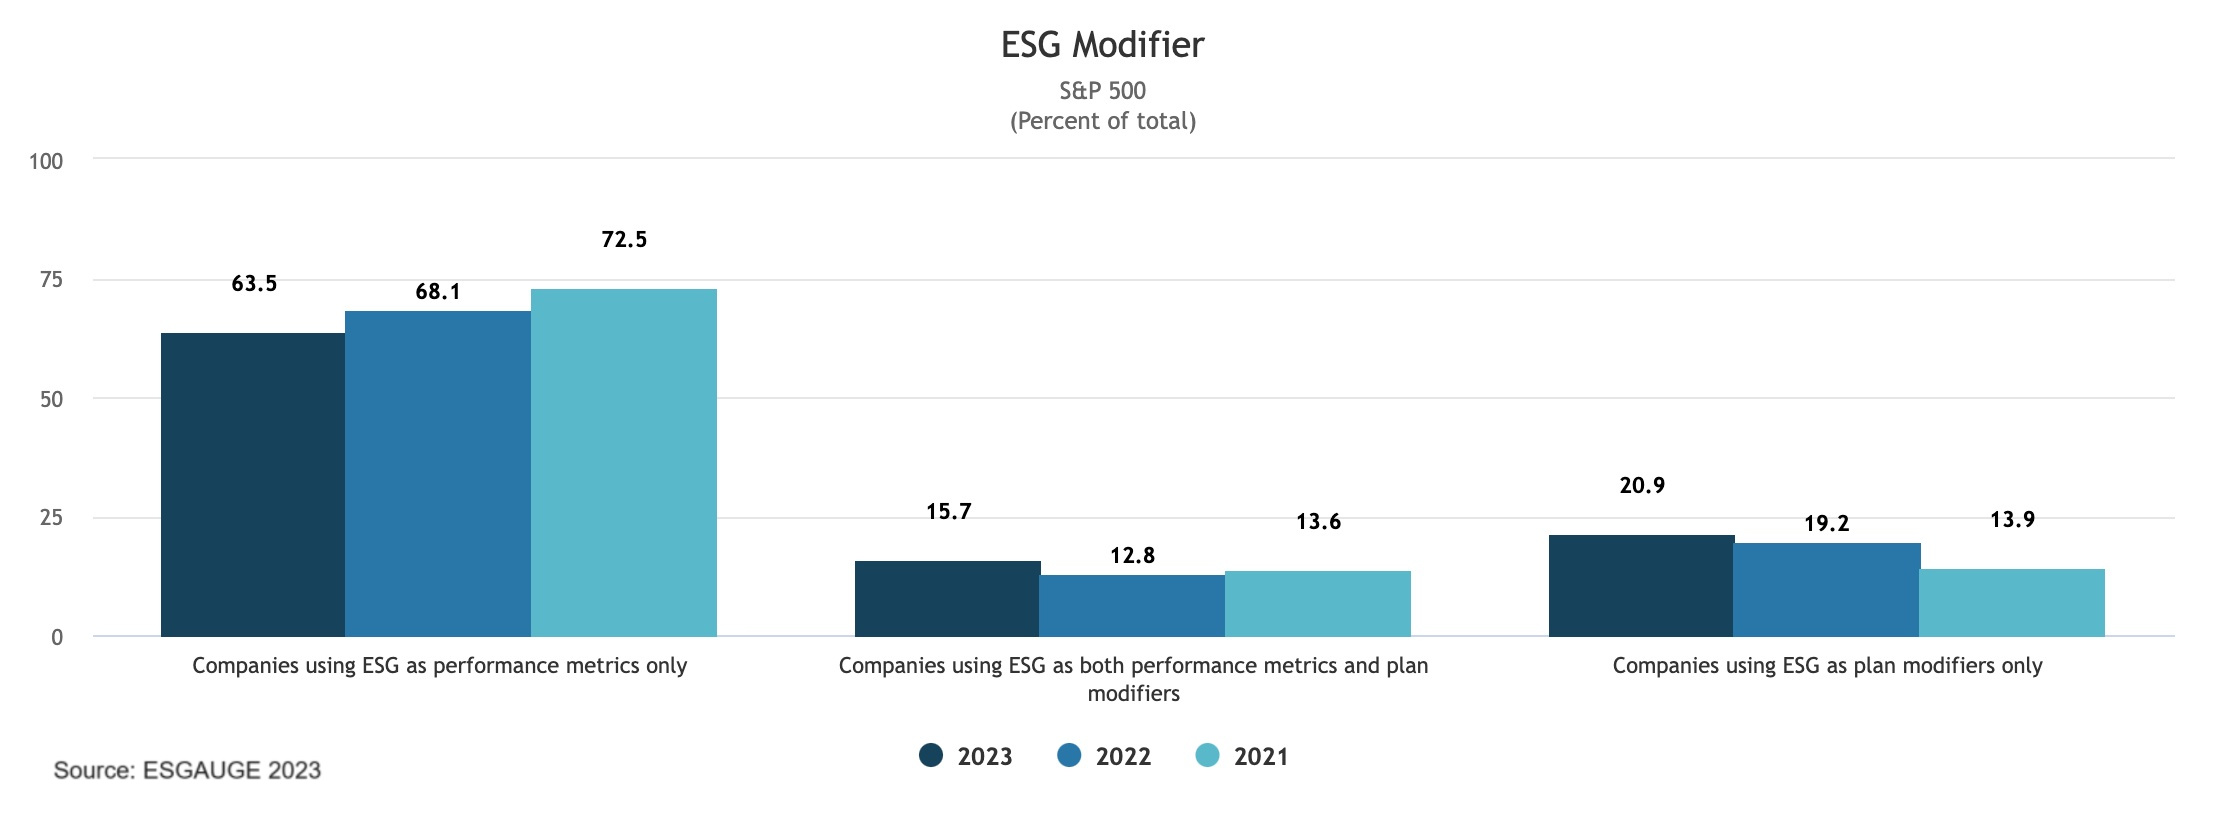
Just as with more traditional financial metrics, ESG metrics can also be used as plan modifiers. Rather than affecting a portion of the total payout, which is what a performance metric would typically do, ESG modifiers adjust the overall plan payout by a specified amount (e.g., +/- 15%). This approach is advocated by some investors, who prefer to first evaluate companies in the traditional way—or based on their core financial performance—and then consider ESG as a plan modifier reflecting the business commitment to sustainability.
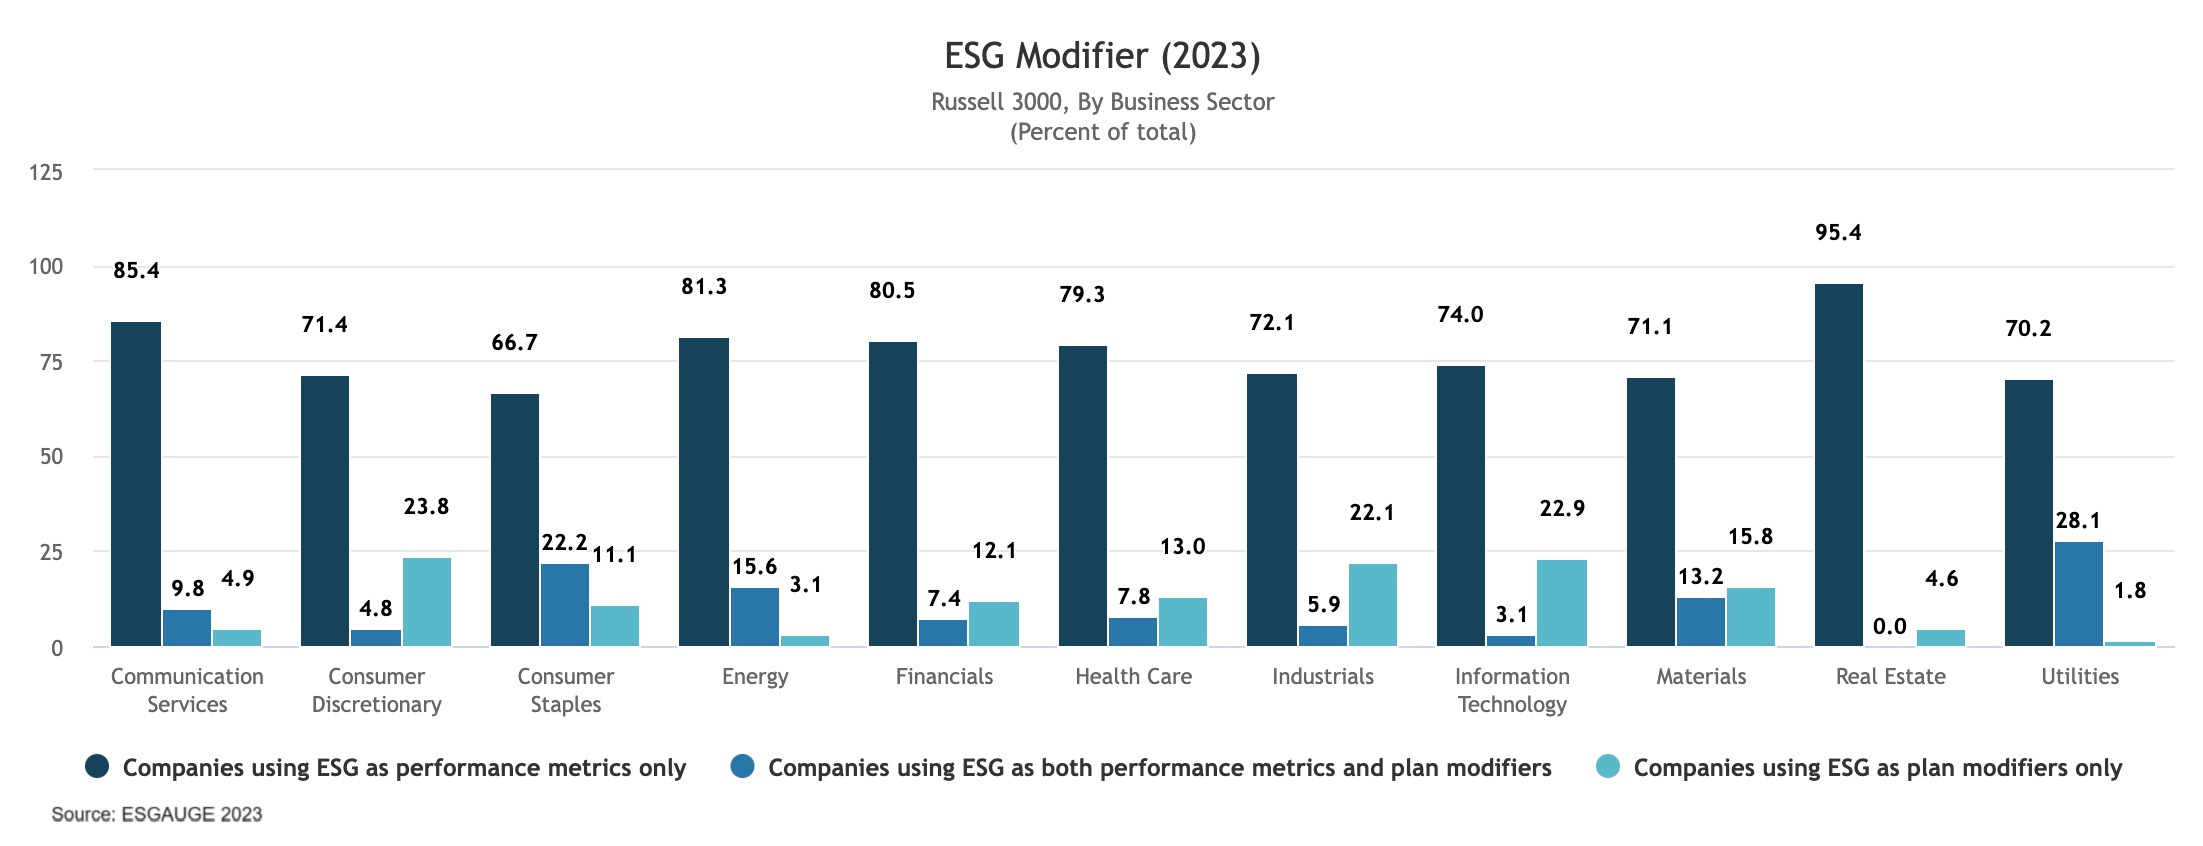
Despite the significant year-over-year increase in the integration of ESG performance metrics in executive incentive plans, instances where companies use ESG as performance metrics only have been declining since 2021 (in the S&P 500, from 72.5% to 63.5% in 2023). On the other hand, the percentage of S&P 500 companies using a combination of ESG performance metrics and ESG modifiers, and the percentage of companies using only an ESG modifier, have both grown (the former from 13.6% in 2021 to 15.7% in 2023 and the latter from 13.9% to 20.9%).
ESG modifiers are more prevalent in certain industries while rare or nonexistent in others. The business sectors reporting the highest percentage of companies that use ESG modifiers only are consumer discretionary (23.8% in 2023, up from 5.2% in 2021), information technology (22.9% in 2023, up from 15%), and industrials (22.1% in 2023, up from 13.6% in 2021). But only 1.8% of utilities companies and 3.1% of energy companies use ESG modifiers only (and in both sectors, the share has declined in the last couple of years). This may be the result of the more advanced understanding of and experience using ESG performance metrics to drive executive behavior that the energy and utilities industries have gained in the recent past.
Even though there is no direct correlation with company size, the integration of ESG performance metrics as modifiers only is much more common among larger companies. Companies with annual revenue in the $5 billion–$9.9 billion range most often report adopting this practice (22.8% in 2023, up from 10.9% in 2021). Only 9.7% of companies with annual revenue under $100 million include ESG modifiers only in 2023, while the percentage is 19.6% for companies with annual revenue of $50 billion and over.
ESG Performance Metric Categories
Our analysis groups ESG performance metrics used in incentive plans into the following categories:
- Environmental, including carbon footprint and emission reduction, chemical containment, and water consumption.
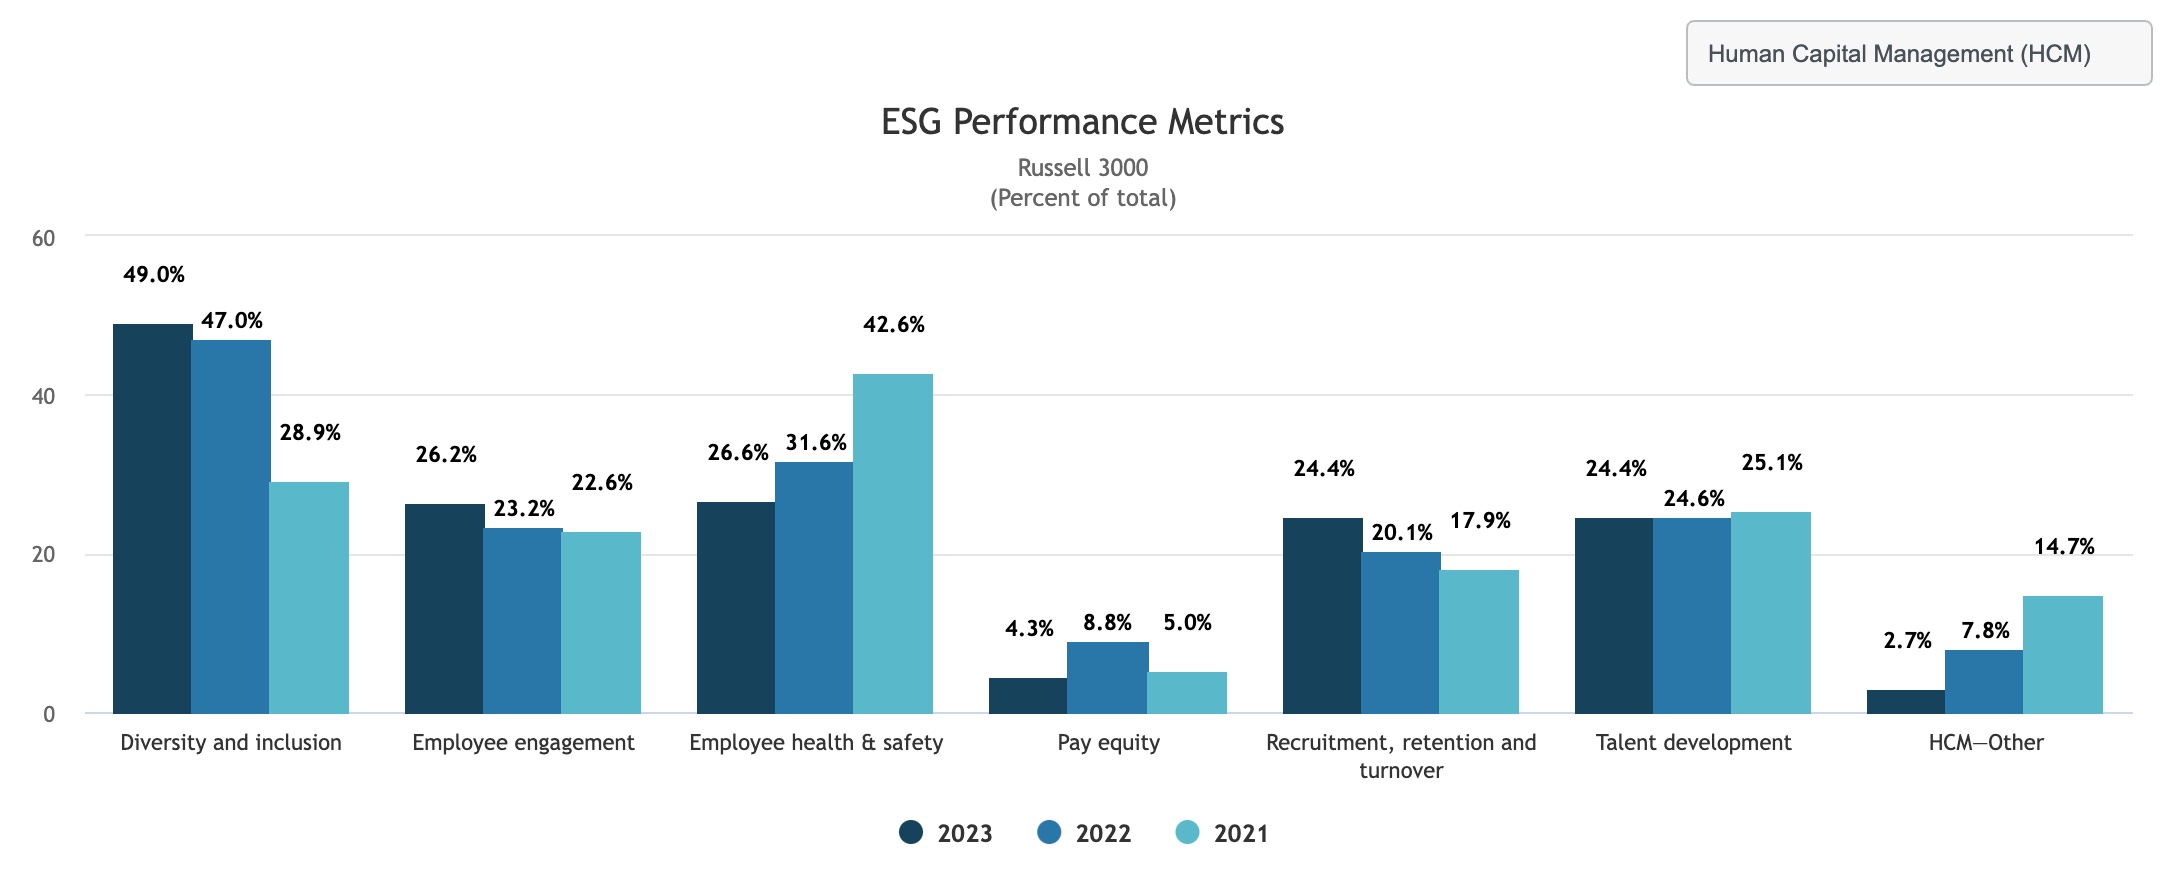
- Human Capital Management (HCM), including diversity and inclusion, employee engagement, and employee health & safety.
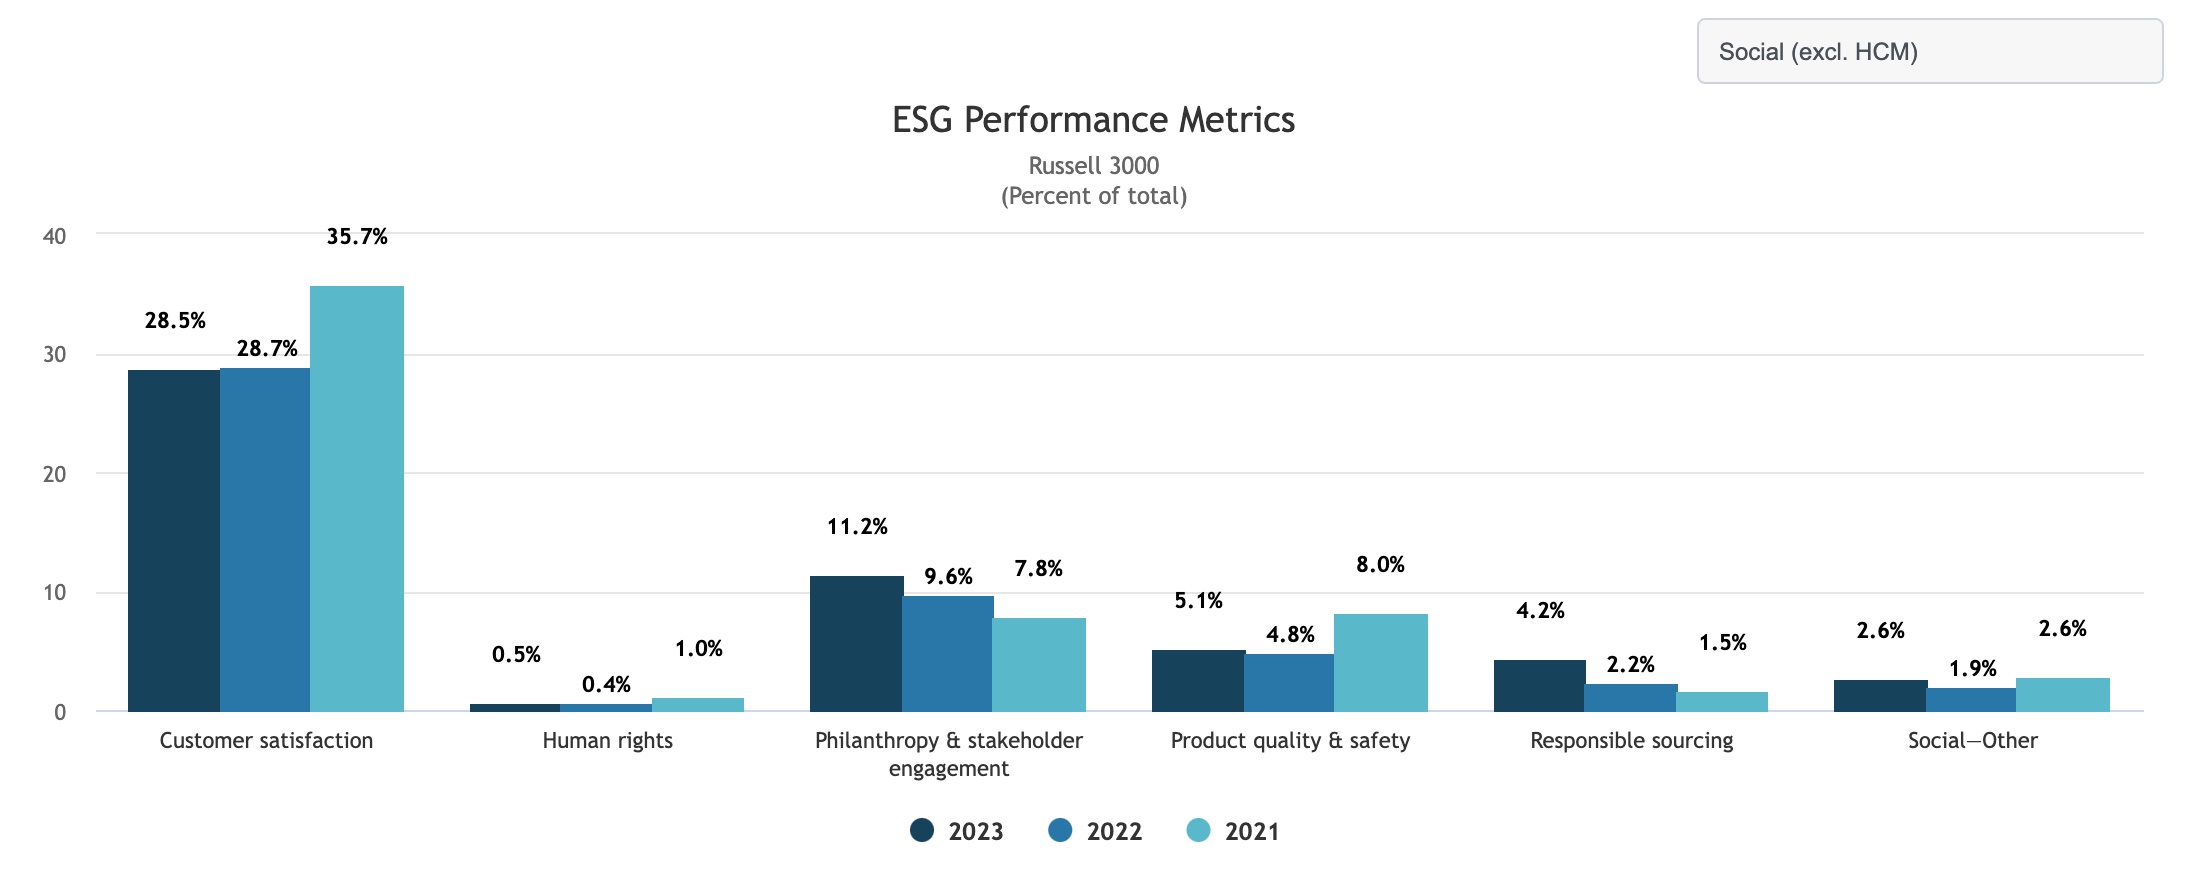
- Social (excl. HCM), including customer satisfaction, product quality & safety, and responsible sourcing.
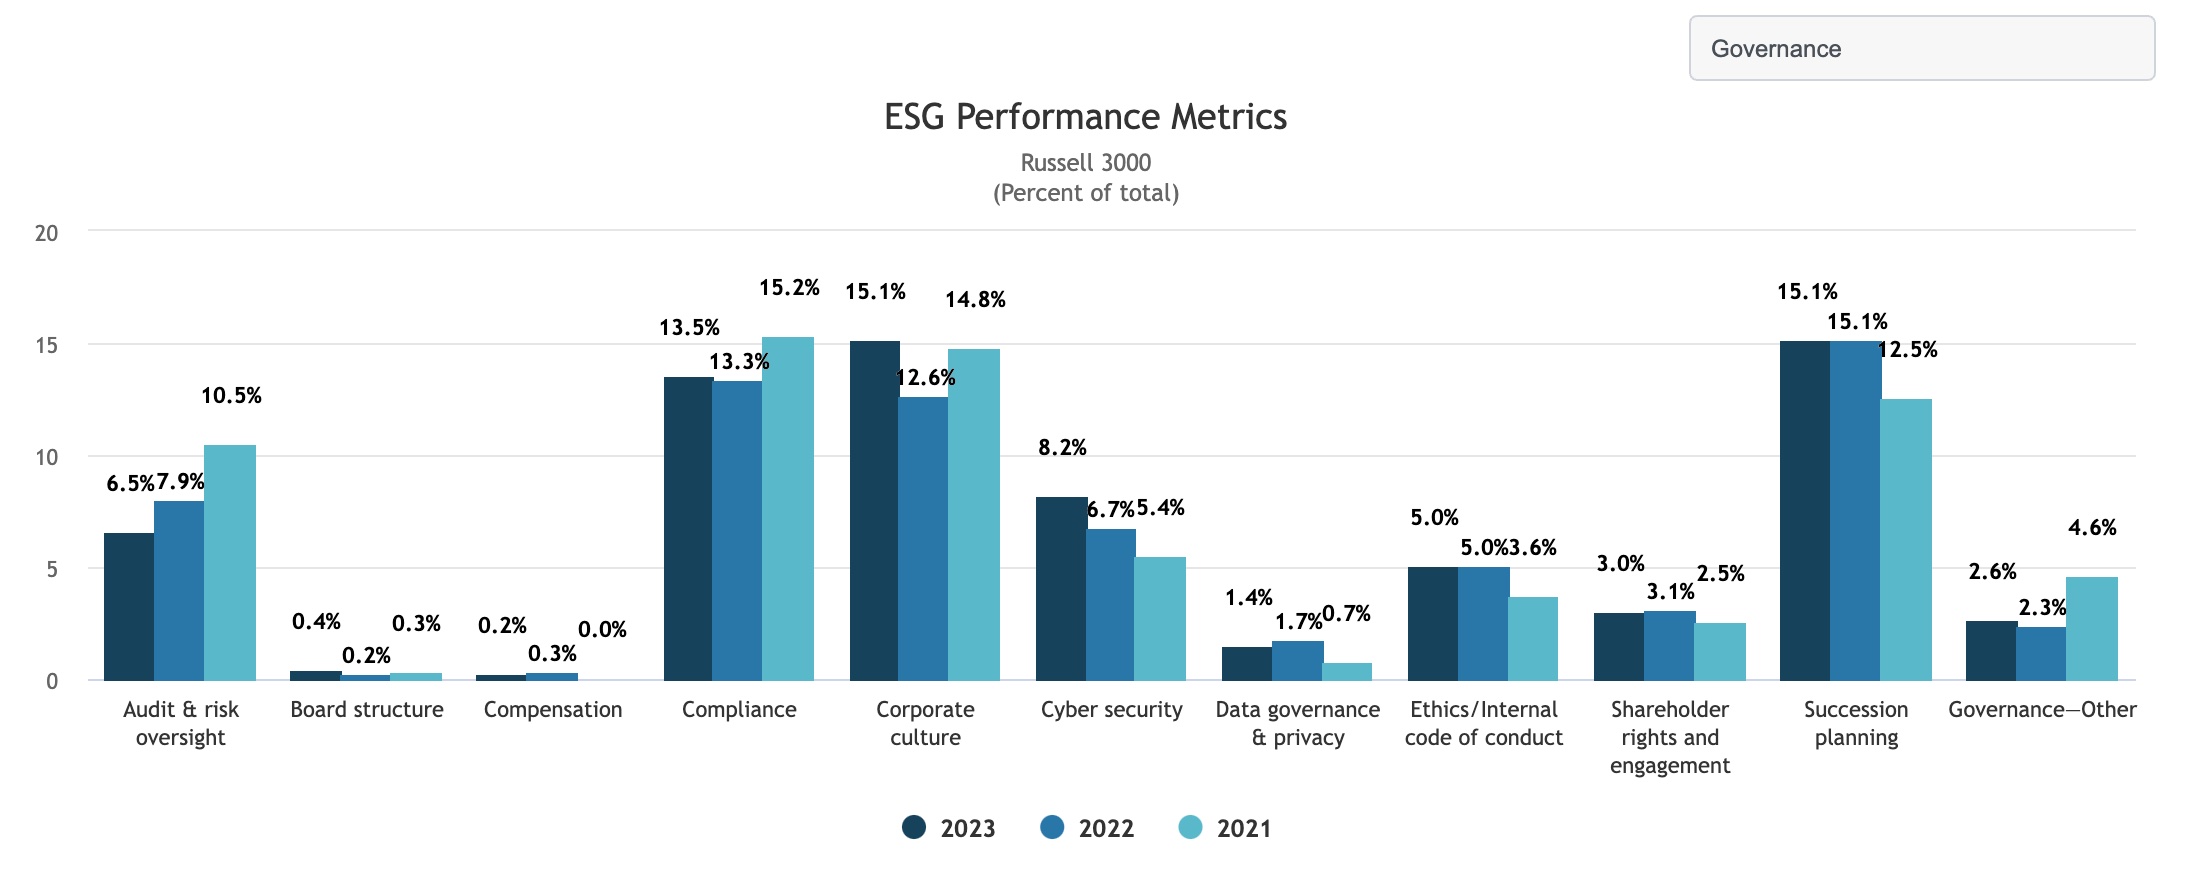
- Governance, including corporate culture, metrics related to the board structure (e.g., board diversity or the transition to an independent board chair), and cyber security.
- General ESG, which we use as a residual category to lodge overarching ESG objectives such as ESG (or CSR) strategy and ESG scoring.
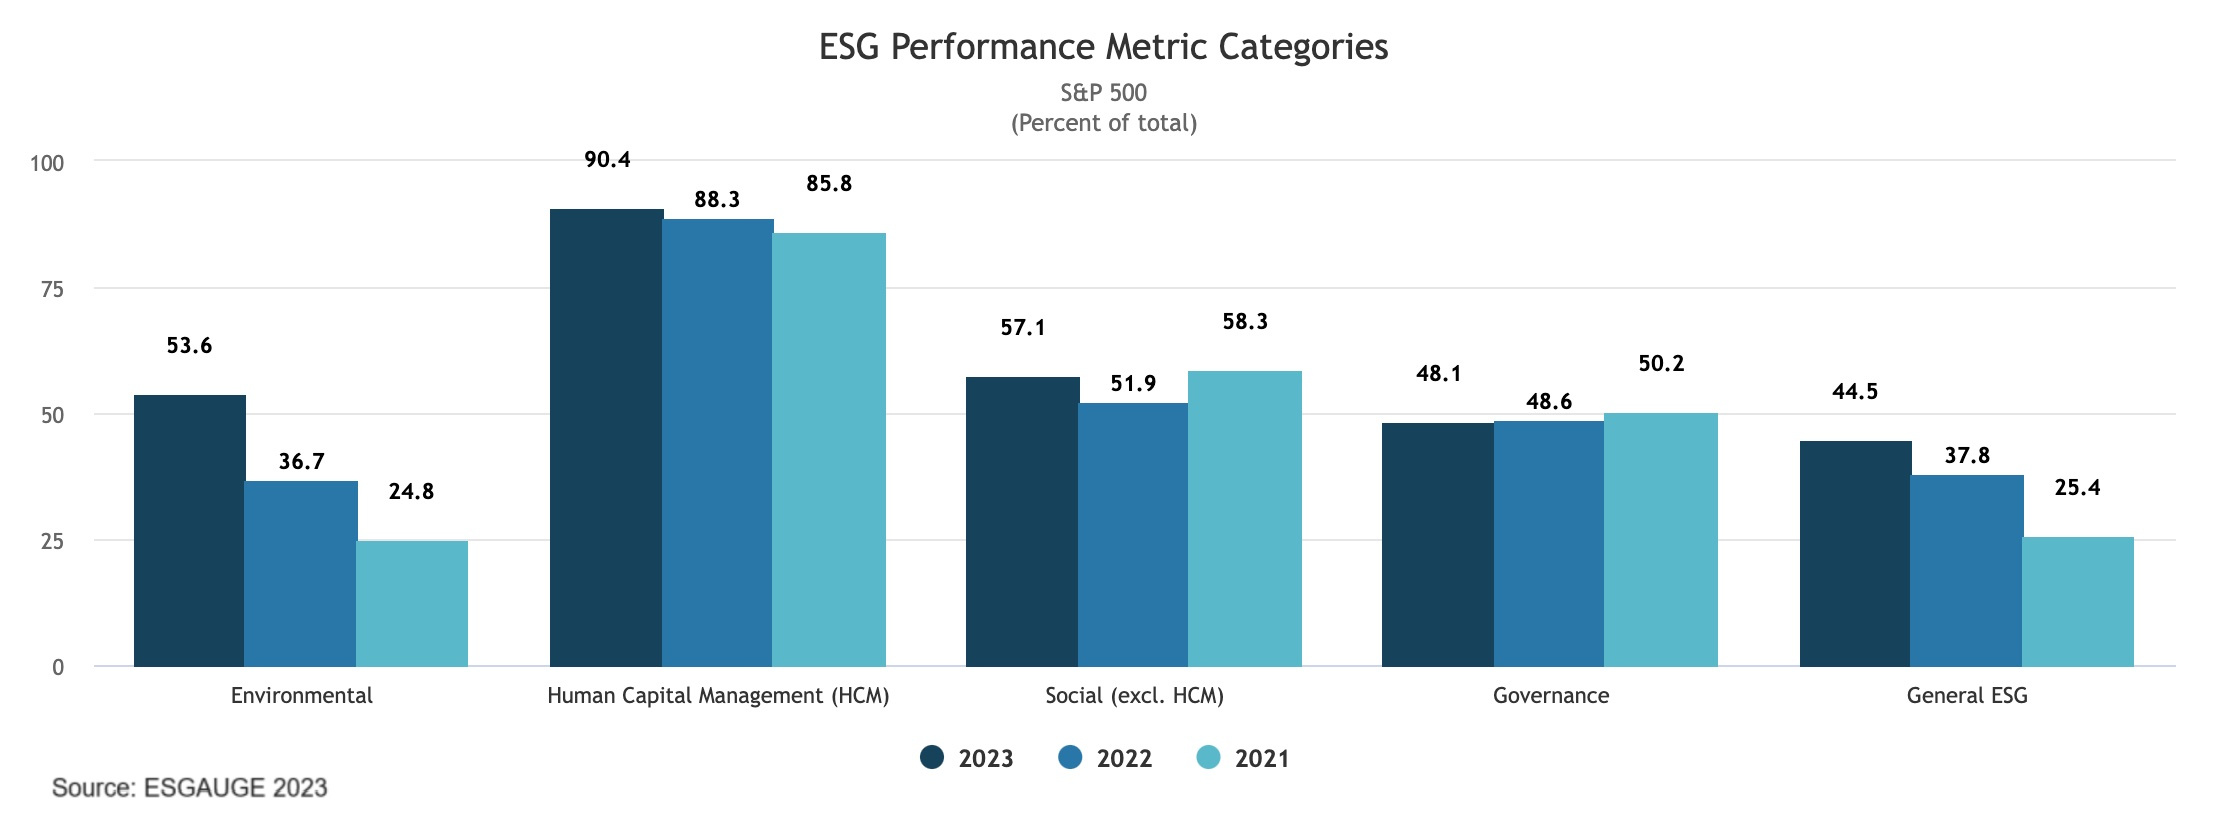
Metrics related to human capital management (HCM) performance remain the most frequently used, but the prevalence of environmental metrics doubled in just two years. HCM metrics are the most frequently used; some 90.4% of S&P 500 companies integrate at least one HCM-related metric in their executive incentive plan (up 4.6 percentage points from the recorded prevalence in 2021). HCM metrics are followed by social metrics (57.1% in 2023, down from 58.3% in 2021), environmental metrics (53.6%, or more than twice as common as the 24.8% in 2021), governance metrics (48.1% in 2023, similar to the 2021 level), and general ESG (44.5% up from 25.4% in 2021).
The choice of ESG performance metrics is currently driven by the business sector in which the company operates. Only 24% of information technology companies integrate environmental performance metrics in their executive incentive plans, compared to 80.2% of energy companies and 66.7% of utilities companies; 9 out of 10 utilities companies also adopt social metrics, compared to only 20.8% of energy and 25% of consumer staples companies. While HCM metrics are generally widely used across the index, consumer discretionary and information technology report the lowest percentages of companies that include them in their incentive plans (68.3% and 68.8%, respectively), while materials report the highest (92.1%). Financials have the highest rate of adoption of governance metrics (69.8%) and energy companies have the lowest (27.1%). Real estate companies have the highest rate of adoption of general ESG metrics (74.3%), and utilities have the lowest (26.3%).
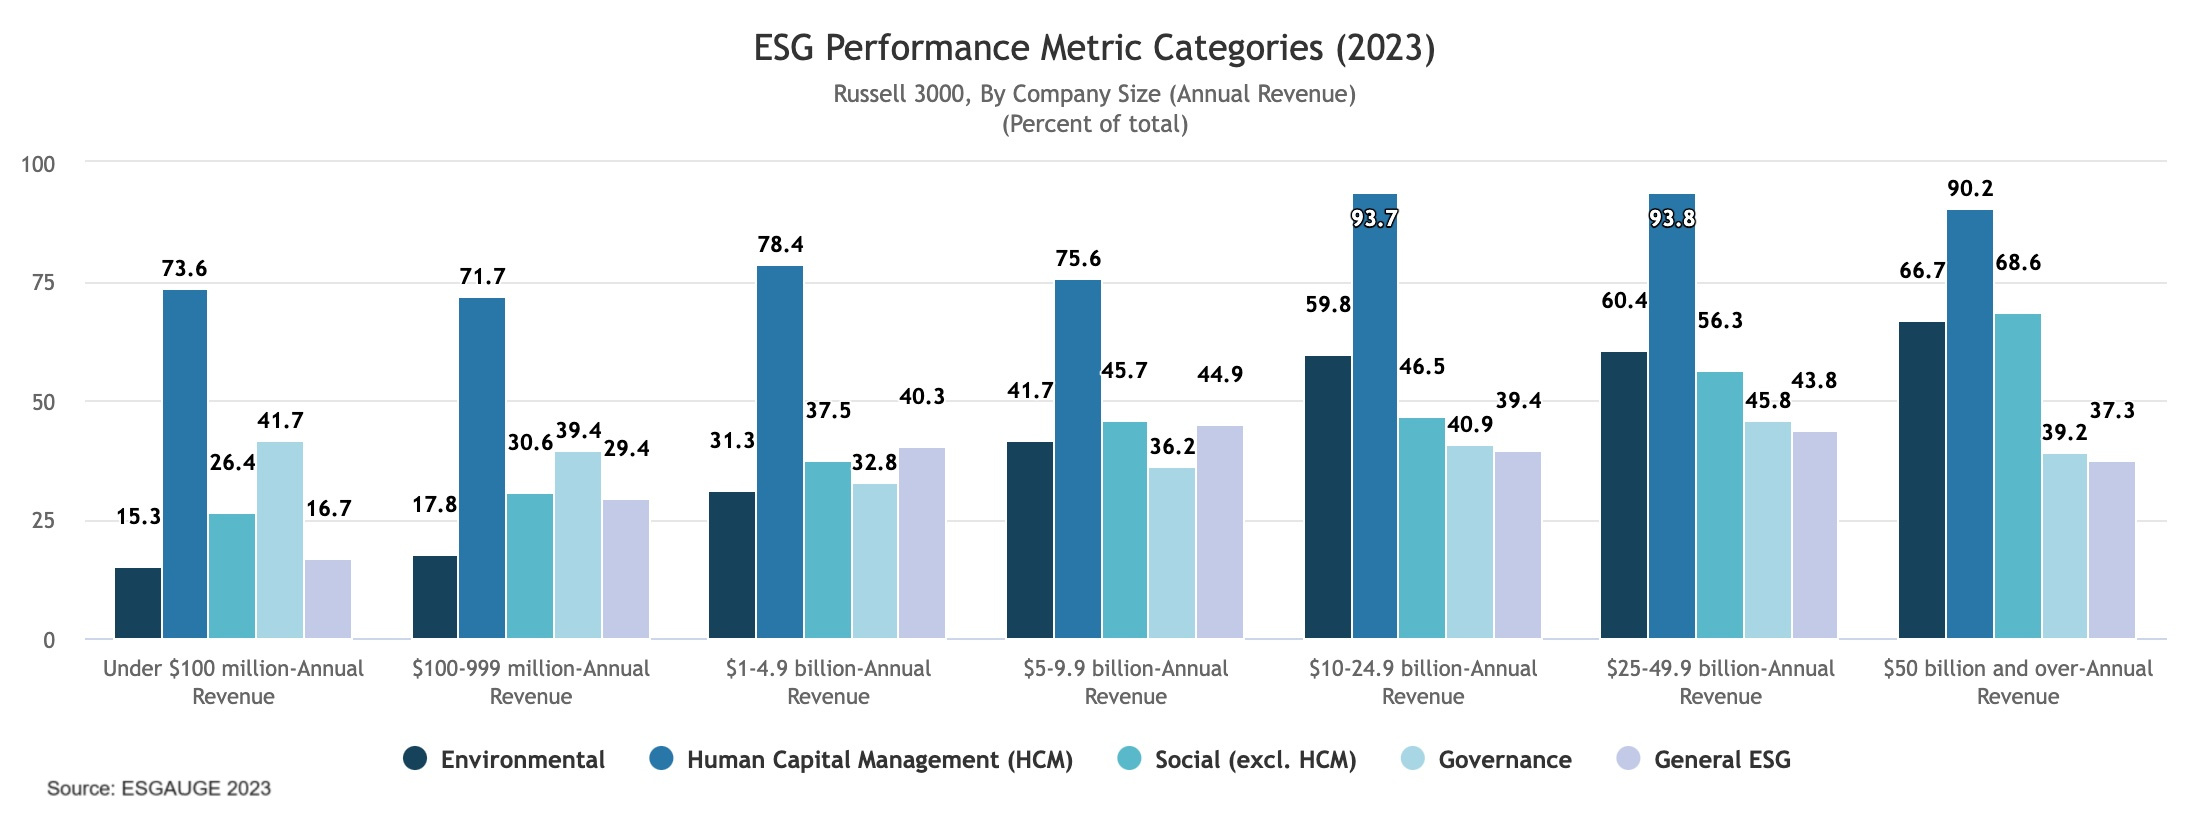
There is a direct correlation between the use of environmental metrics in incentive plans and the size of the company. Only 15.3% of Russell 3000 companies with annual revenue under $100 million use performance metrics from this category as compensation incentives—up from 14.9% in 2021. But the prevalence of environmental metrics rises to 41.7% (up from 24.8% in 2021) for companies with annual revenue of $5 billion–$9.9 billion, and to 66.7% (up from only 26.8% in 2021) for companies with annual revenue of $50 billion and over. A similar correlation with company size is seen for the social metric category, while HCM metrics are widely used even among smaller companies (some 73.6% of companies with annual revenue under $100 million), and governance metrics are reported at equal levels in the smallest (41.7%) and the largest (39.2%) of the examined company size groups.
Mix of ESG performance metric categories
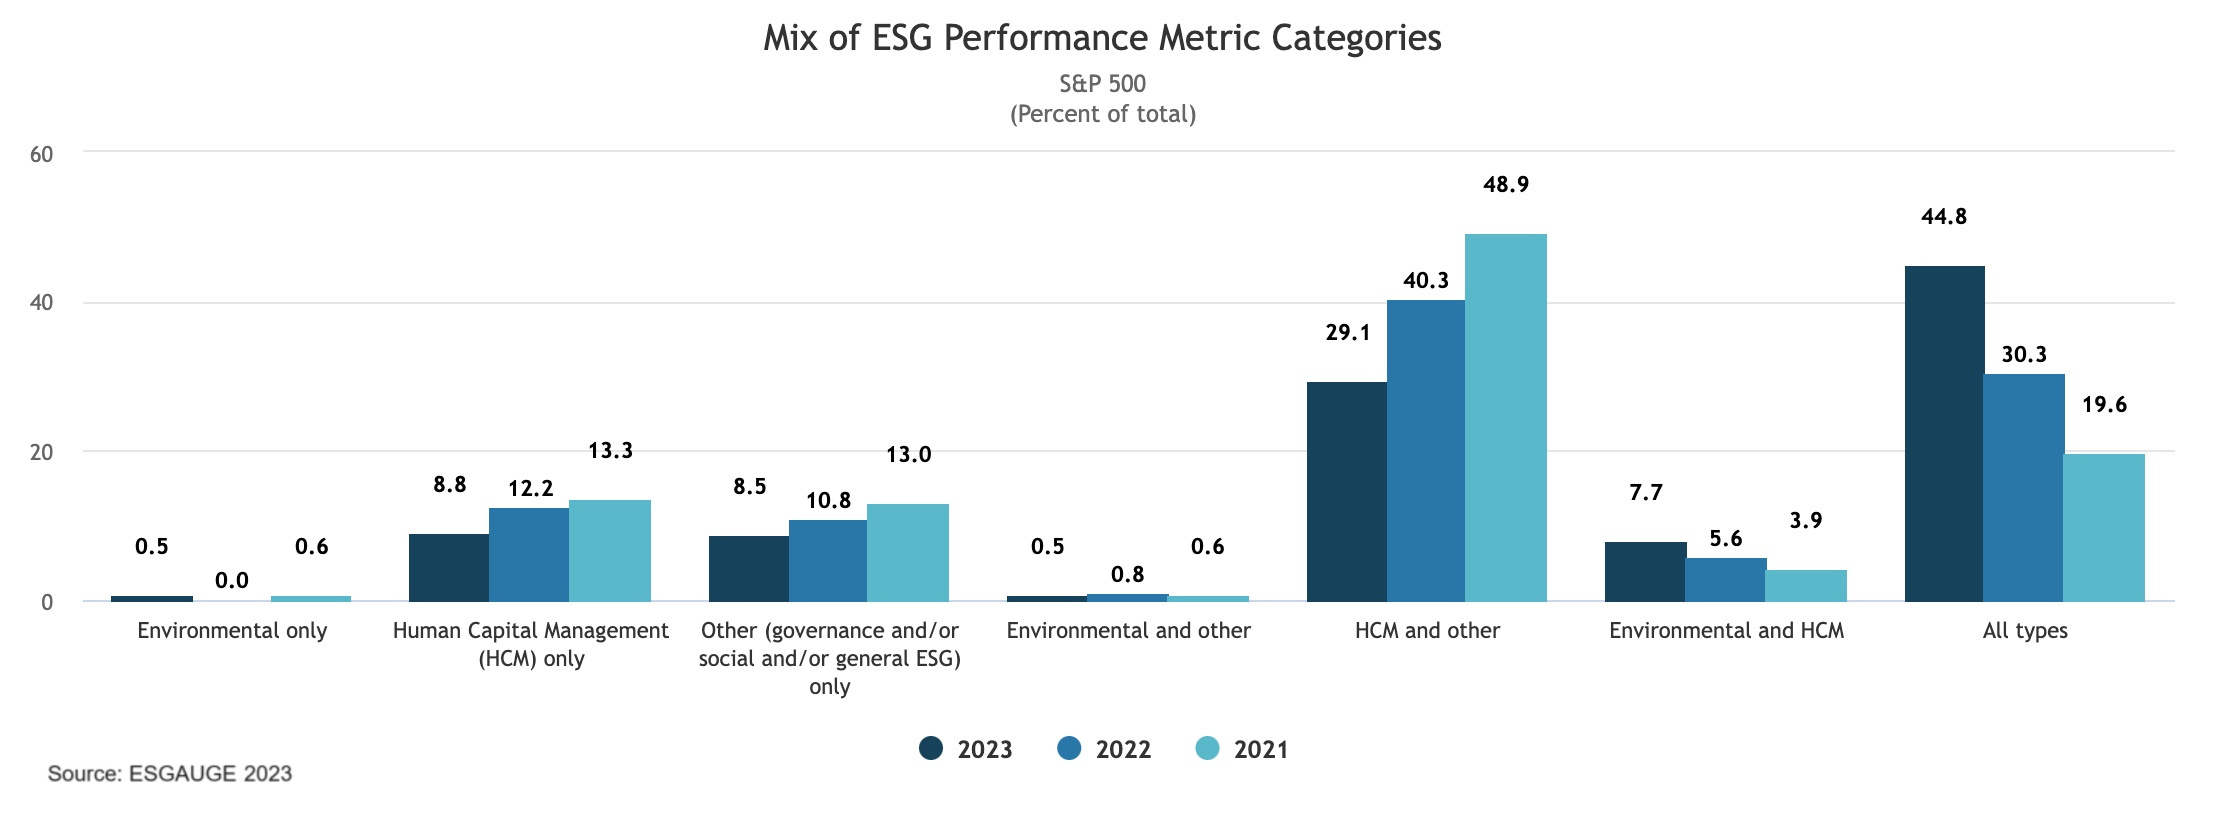
Companies rarely use only a single category of ESG metrics. In the S&P 500 index, for example, just 0.5% of companies integrate only environmental metrics in their executive incentive plans, while the percentage rises to 8.8% for companies with HCM metrics only. The most prevalent mix of ESG metrics contains metrics from each of the categories above (44.8% in the S&P 500 and 24% in the Russell 3000). About 29.1% of S&P 500 companies adopt a combination of HCM and other (nonenvironmental) performance metrics, such as metrics related to governance, social, or general ESG objectives, while 7.7% use a combination of environmental and HCM metrics.
The company size analysis shows a direct correlation between the percentage of companies that deploy ESG metrics from all categories and the size of the company (from 11.1% of companies with annual revenue under $100 million to some 56.9% of companies with annual revenue of $50 billion and over).
ESG Performance Metrics
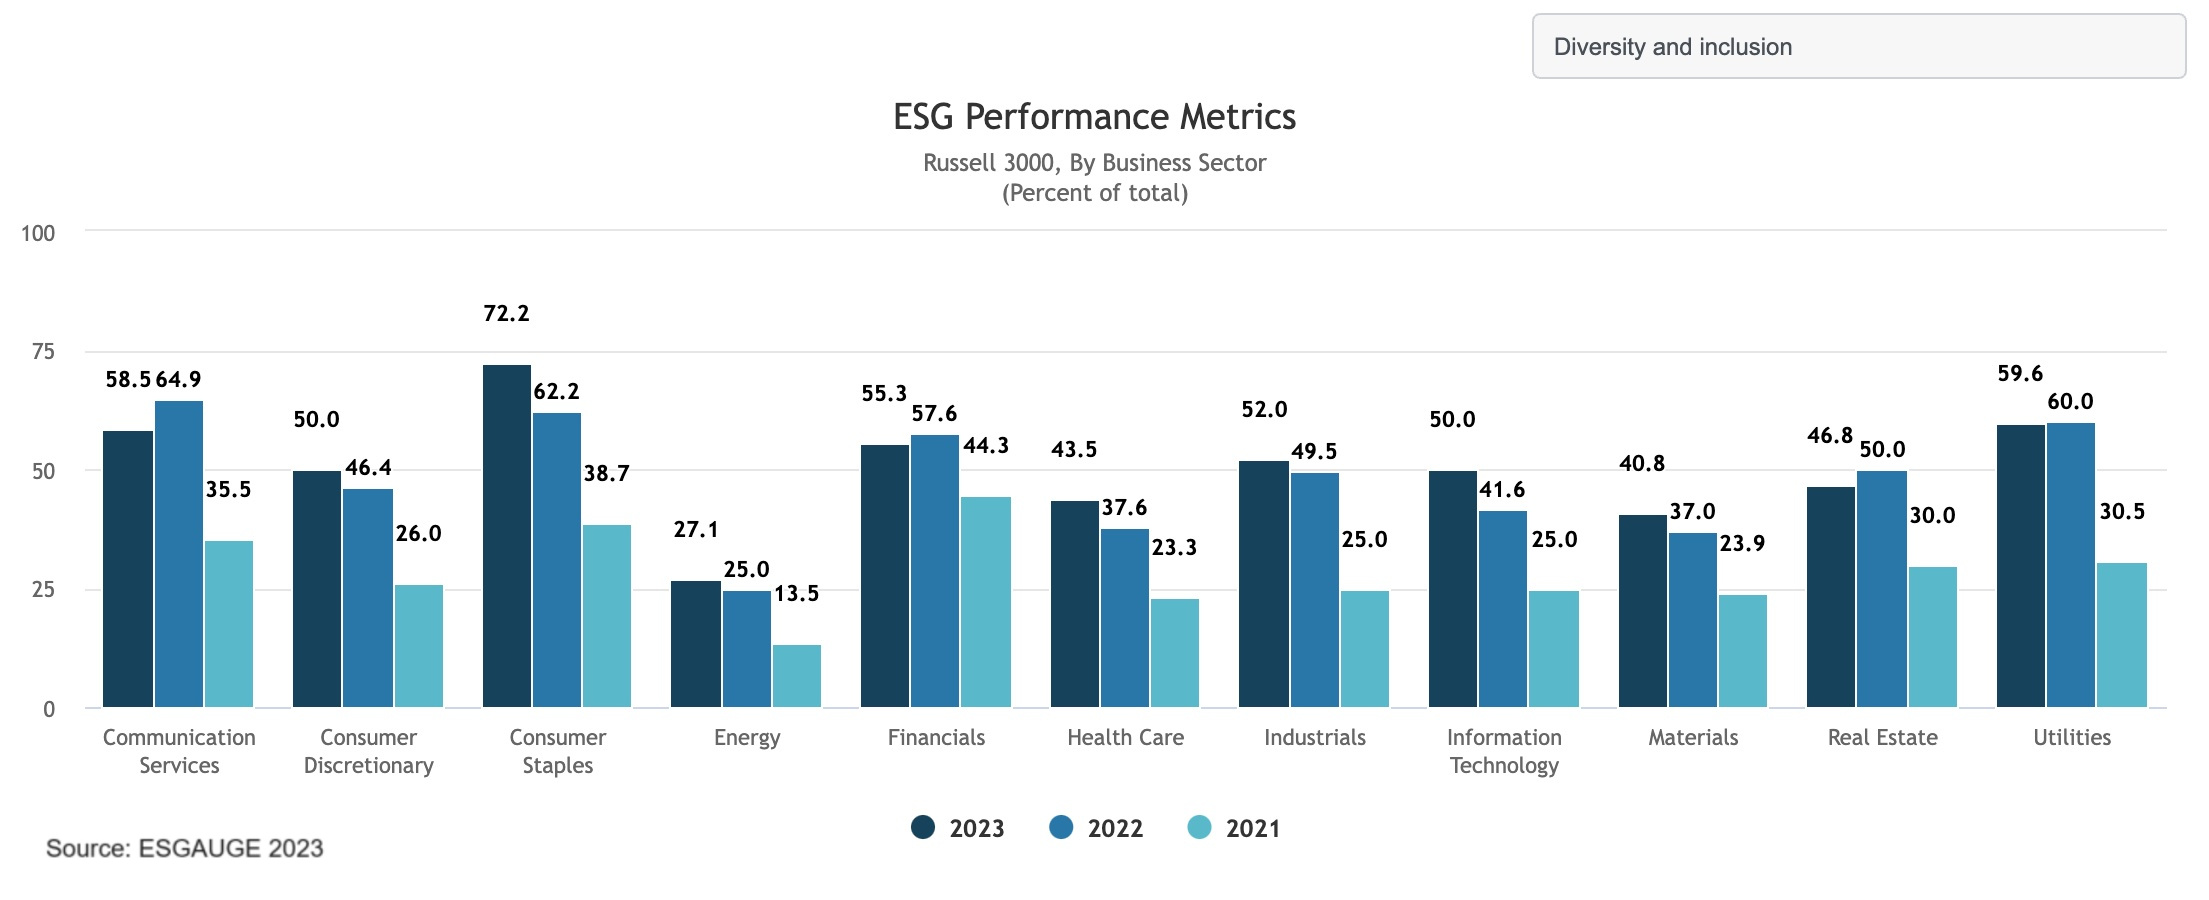
The most frequently used ESG performance metrics reflect companies’ commitment to diversity and inclusion and to net-zero environmental impact. Diversity and inclusion measures are used by some 75.3% of S&P 500 companies (up more than 20 percentage points since the level recorded in 2021), and far more frequently than more traditional operating metrics such as customer satisfaction (37.4% in the S&P 500) and employee health & safety (30.5%). In the Russell 3000 index, diversity and inclusion is found in about half (49%) of the incentive plans.
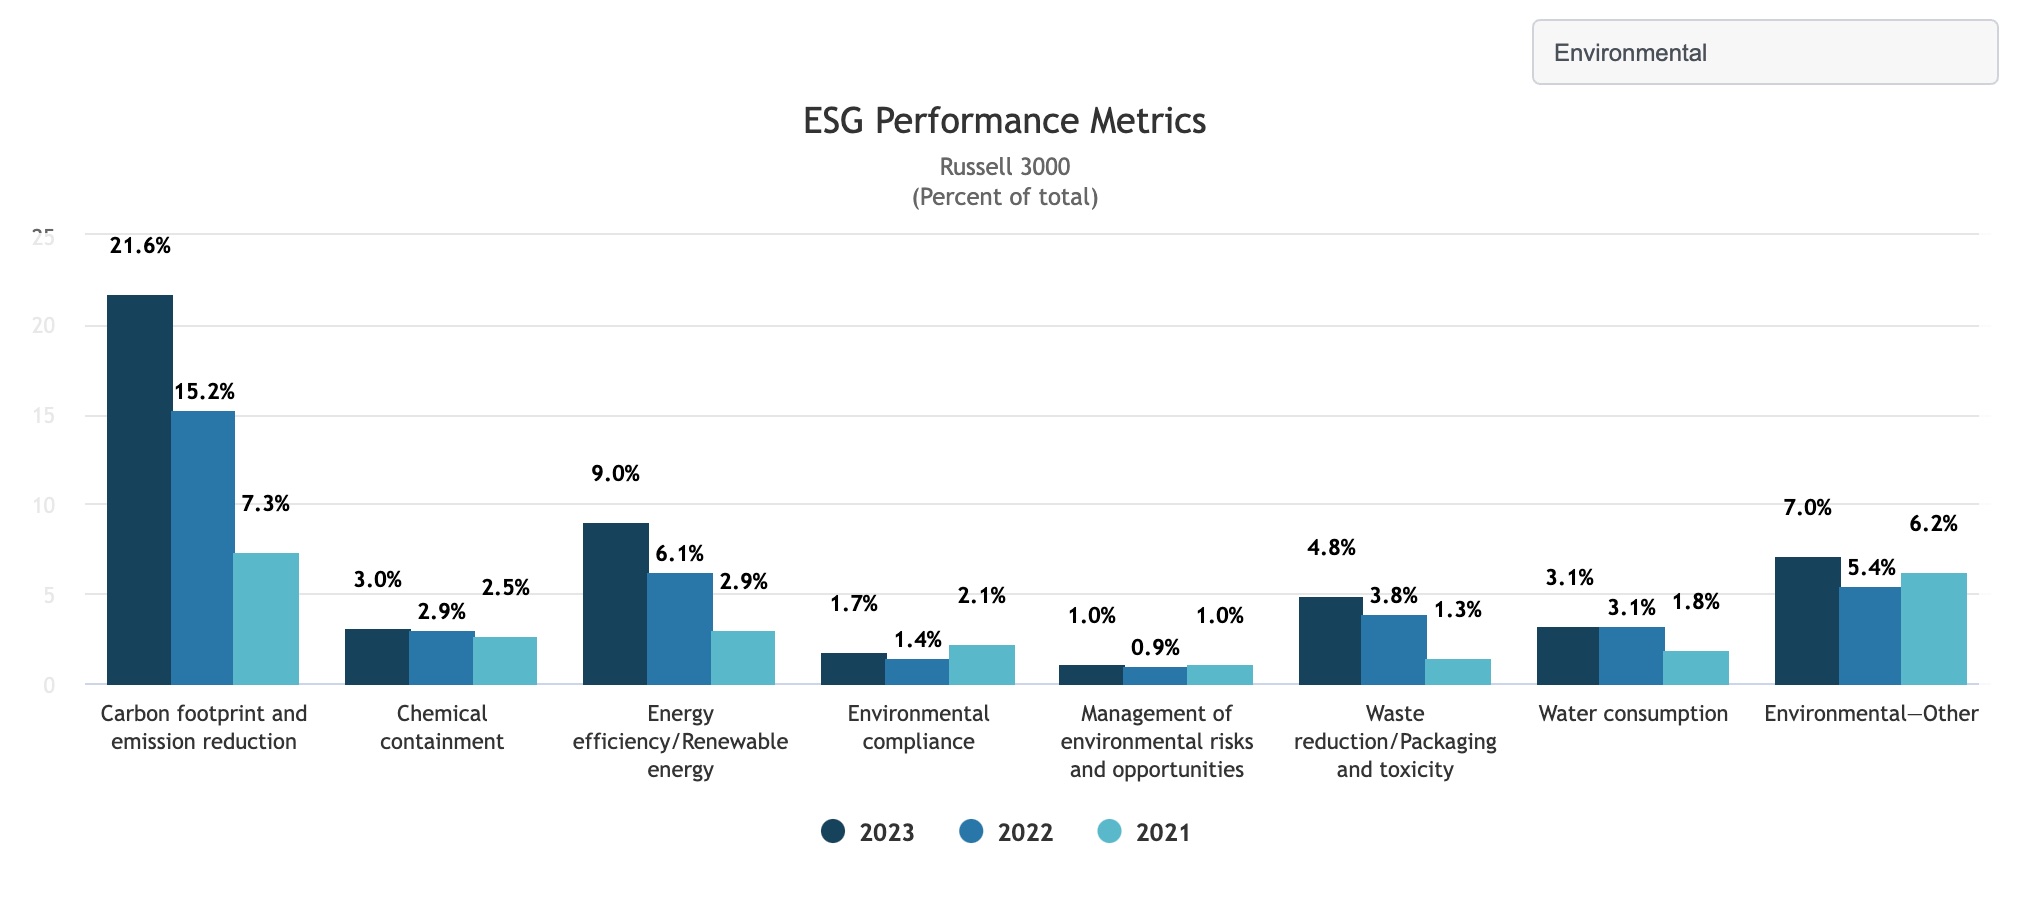
Carbon footprint and emission reduction metrics are the second most prevalent, used by 38.7% of S&P 500 companies (up from 14.8% in 2021), followed by customer satisfaction (37.4%, down from 46.2% in 2021), employee engagement (37.1%), ESG (or CSR) strategy (34.1%, up from 14.5 in 2021), and employee health & safety (30.5%, down from 48.9% in 2021). Other HCM-related metrics—talent development (30.8%, down from 34.7% in 2021) and recruitment, retention & turnover (27.7%) scored among the top-10 most used ESG metrics in the S&P 500.
Governance is the only category with no metrics surpassing the 30% mark: among governance metrics, the most prevalent in the S&P 500 are corporate culture (21.2%) and succession planning (17.9%). Only 9.6% (up from 7.9% in 2021) of S&P 500 companies integrate metrics related to cybersecurity into their executive compensation plans.
While the prevalence of diversity and inclusion metrics hovers over 50% across sectors, the use of customer satisfaction metrics can vary greatly depending on the business type: almost 9 out of 10 utilities companies adopt customer satisfaction as a compensation incentive for their executives, followed by companies in the financials (39.5%), information technology (36.5%), and consumer discretionary (33.3%) industries; the other end of the spectrum includes companies in materials (7.9%) and real estate (14.7%). Notably, only about 1 in 4 Russell 3000 companies in the health care sector (24.4%) integrate customer satisfaction into the compensation plan of their top leaders.
Use of talent development metrics is prevalent across all business sectors, but they are more commonly used in industries that rely on highly specialized skills and longer career development tracks such as financials (31.6%), health care (28%), and information technology (19.8%). Similar considerations apply for metrics related to recruitment, retention & turnover—adopted by some 42.5% of health care and 36.7% of financials companies. Utilities is the only sector reporting single-digit use of recruitment, retention & turnover (3.5%).
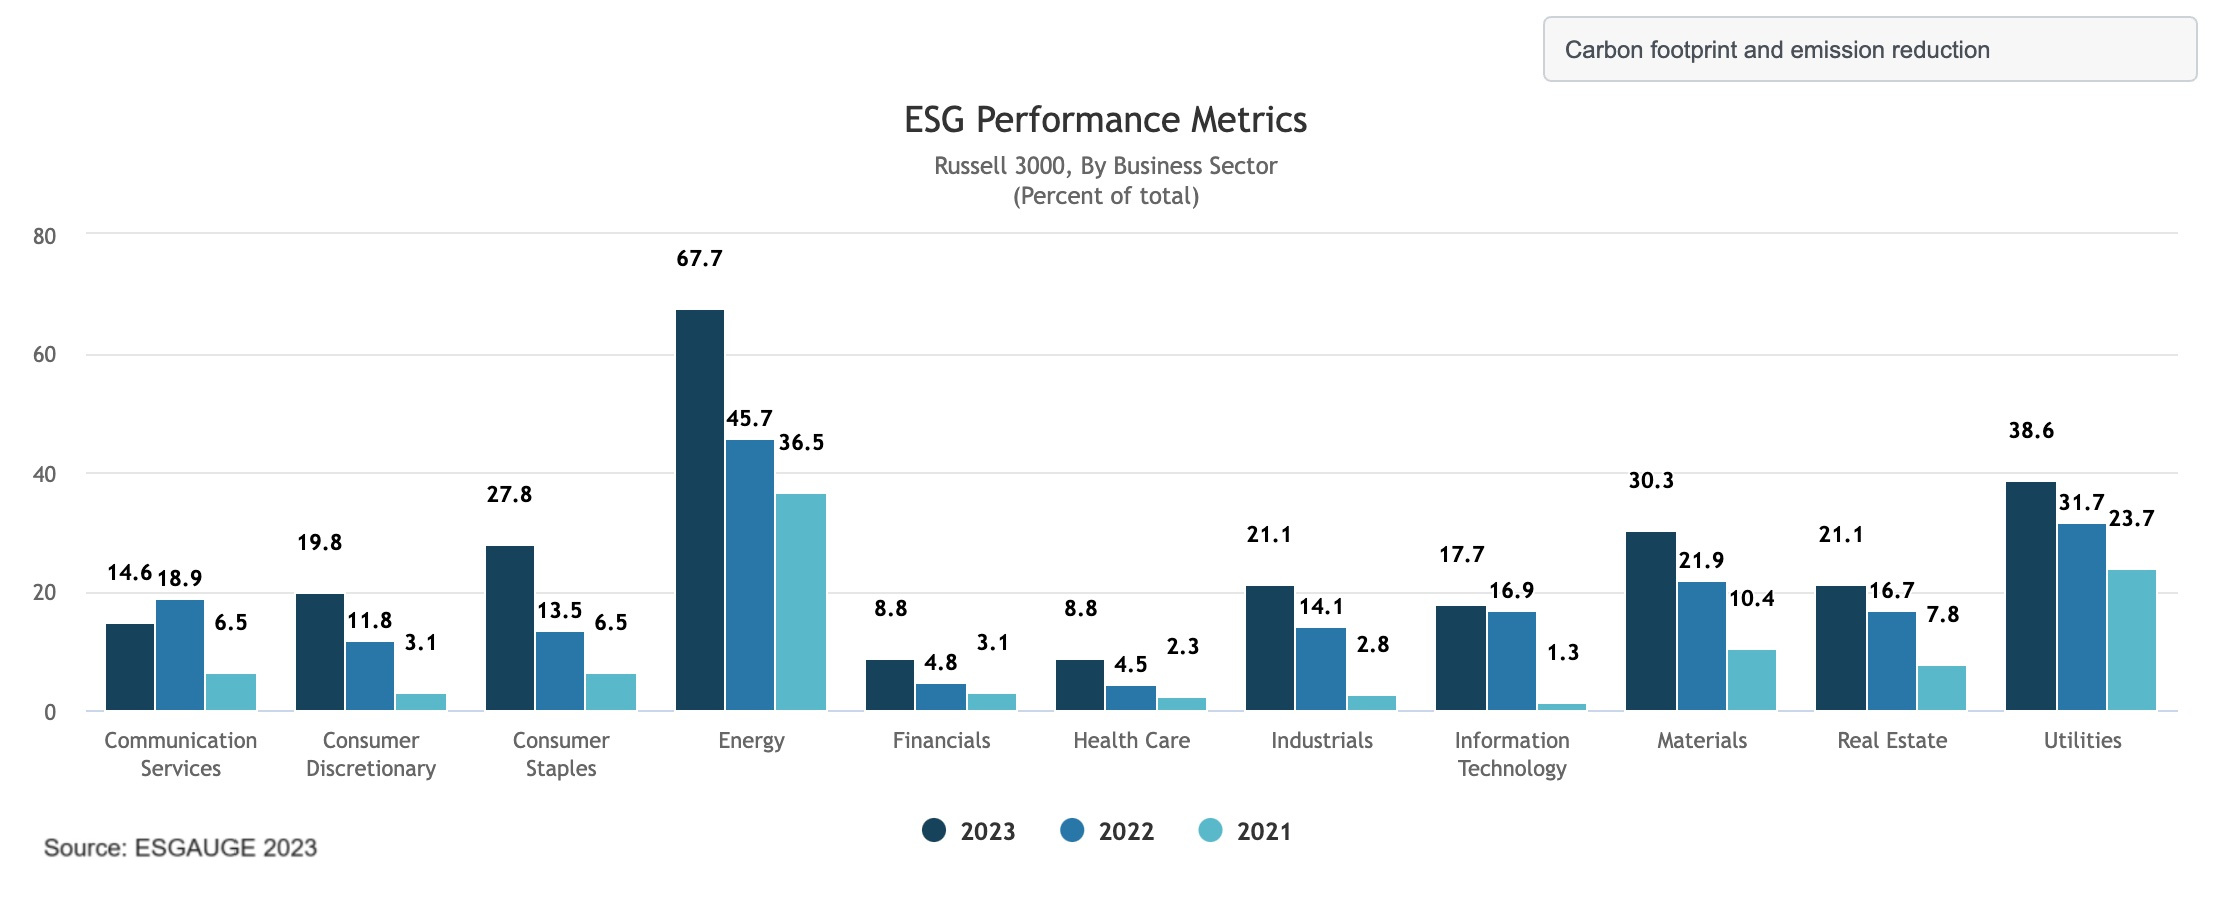
Companies with traditionally high environmental impact such as energy and utilities are increasingly turning to carbon footprint and emission reduction metrics to drive their strategy execution (67.7% in energy, up from 36.5% in 2021; and 38.6% in utilities, up from 23.7% in 2021). Only 17.7% of information technology, 14.6% of communication services, 8.8% of financials, and 8.8% of health care companies integrate carbon footprint and emission reduction metrics into their executive incentive plans.
While metrics in the HCM category and some governance metrics can be just as commonly used among small companies as among their larger counterparts, the prevalence of environmental metrics tends to increase as the size of the company increases. For example, 43.1% of companies with annual revenue under $100 million use recruitment, retention & turnover metrics, and 16.7% of such companies use corporate culture metrics—in both cases, these percentages are higher than those recorded among larger companies. More than a quarter of companies with annual revenue in the $100 million–$999 million range integrate customer satisfaction into their executive incentive plans—lower than the percentage larger companies report, but not significantly so. But the use of carbon footprint and emission reduction metrics goes from 6.9% among companies with annual revenue under $100 million to 52.1% at companies in the $25 billion–$49.9 billion annual revenue group.
Conclusion
ESG backlash, which has been mounting since early 2022,[2] has not dissuaded companies from continuing to integrate ESG-related performance metrics into the incentive plans for their CEOs and senior executives. It may, however, prompt a reconsideration of the measures that should be employed.
As the rate of adoption of ESG performance metrics increases, compensation committees are becoming accustomed to setting more precise ESG-related targets and to conducting nondiscretionary forms of assessment of ESG performance. Metrics related to human capital management performance remain the most frequently used, but the prevalence of environmental metrics has doubled in just two years. The most frequently used ESG performance metrics reflect companies’ commitment to diversity and inclusion and to net-zero environmental impact.
As companies more deeply integrate sustainability into their business strategy, operations, and culture, the next generation of ESG performance measures in executive compensation is likely to reflect these trends, while also being more tailored to the company’s specific circumstances and goals for achieving competitive advantage and societal impact.
- Expect companies to continue to link executive compensation to ESG performance, even in the face of growing ESG backlash. According to 2023 disclosures, 75.8% of S&P 500 companies incorporate ESG performance in compensation design, compared to 66.5% in 2021. As part of their general response to ESG backlash, companies should take a fresh look at how they include ESG objectives in executive compensation. Choosing these metrics carefully is crucial to ensure an executive compensation plan that drives sustainable value creation.
- Compensation committees should identify and prioritize ESG factors tied to their company’s long-term business strategy. Currently, ESG performance metrics tend to relate to the company’s industry: for example, only 24% of information technology companies integrate environmental performance metrics in their executive incentive plans, compared to 80.2% of energy companies. As organizations integrate sustainability more deeply into their operations, they should select incentives that give them a competitive advantage while serving a broader societal purpose.
- Companies now have more experience with ESG metrics and a greater wealth of benchmarking information to enable them to include ESG measures in long-term incentive programs. The percentage of S&P 500 companies that integrate ESG performance metrics in both their annual incentive plan and their long-term incentive plan has grown from 7.3% in 2021 to 12.4% in 2023. Given the long-term nature of many ESG goals, incorporating them in LTI plans may be a natural fit.
- While considering ESG as part of individual performance assessments continues to be the predominant practice, companies are moving toward more quantifiable and less discretionary objectives. In the S&P 500, 31% of firms now use discrete, weighted (stand-alone) ESG metrics, compared to 25.5% in 2021, and 35.2% use strategic scorecards that include one or more ESG metrics, compared to 20.9% two years ago. Compensation committees may wish to consider a combination of approaches, depending on the nature and ability to quantify the specific objective.
- Companies that do not yet do so should investigate using ESG metrics to drive human capital management and environmental performance— two areas where investor and regulatory scrutiny continue to increase. Some 90.4% of S&P 500 companies now integrate at least one HCM-related metric in their executive incentive plan, and 53.6% deploy environmental metrics. In so doing, companies should consider measures that reflect their specific workforce strategies and environmental risks and opportunities, rather than just off-the-shelf GHG and DEI metrics.
Methodology and Access to our Live Dashboard Data
The Conference Board and ESG data analytics firm ESGAUGE track the use of ESG performance metrics in the executive incentive plans of US public companies. This analysis is based on the review of the disclosure included by Russell 3000 and S&P 500 companies in their proxy statements’ Compensation Discussion and Analysis (CD&A) section. Data for 2023 (which is as current as December 4, 2023) is compared with the disclosures made in the previous two years. To provide additional insights, the analysis extends to data cuts by 11 GICS sectors and 14 company size groups (by annual revenue and asset value).[3]
The project is conducted in collaboration with executive compensation consulting firm FW Cook.
Data discussed in this report can be accessed and visualized online through an interactive Live Dashboard at conferenceboard.esgauge.org/ESGmetrics
Endnotes
1See, for example,
2See Andrew Jones, ESG Backlash: How Companies Can Turn Adversity Into Advantage, The Conference Board, Research Report, May 24, 2023; and How Companies Can Address ESG Backlash, The Conference Board, Research Report, August 1, 2023. Also see Paul Washington and Andrew Jones, ESG Backlash Is Real and Growing. What to Know, The Conference Board, Essay, September 21, 2023.(go back)
3This report builds on earlier analyses of the subject conducted by The Conference Board in recent years. See Merel Spierings, Linking Executive Compensation to ESG Performance, The Conference Board, Research Report, October 28, 2022. Also, Paul Washington and Merel Spiering, What Boards Should Ask Management About Compensation and ESG, The Conference Board, Research Report, January 30, 2023.(go back)