Subodh Mishra is the Global Head of Communications at ISS STOXX. This post is based on an ISS-Corporate memorandum by Danielle Rizak and Will Harrington, Compensation & Governance Advisors with ISS-Corporate.
Key Takeaways
- CEO pay is at an all-time high with the median S&P 500 CEO pay of $16.4 million and 11% increase from the previous year for Russell 3000, driven largely by increases in long-term incentive pay;
- Both the value and prevalence of CEO security perquisites increased sharply among S&P 500 companies, underscoring the increased safety concerns;
- Despite high CEO pay, say-on-pay support remained strong with failed say-on-pay well below historical norm; fewer instances of discretionary pay adjustments and one-time grants likely contributed to strong shareholder support;
- Dramatic declines in the usage of DEI and climate-related metrics after a period of rapid adoption in the past few years suggest a shift in corporate priorities and disclosure practices;
- Post-season engagement with shareholders on compensation policies may prove to be more challenging due to changes in SEC guidance.

While the 2025 proxy season was marked by significant shifts on governance practices and priorities , executive compensation continued to normalize following pandemic-driven disruptions. Uncertainty and volatility during the pandemic led to increased one-time compensation decisions and a spike in discretionary pay adjustments. These irregular actions resulted in increased opposition to compensation-related proposals as seen in increased failures.
As companies recovered and the effects of the pandemic fade, incentive programs normalized, and CEO pay continuously rose, backed by strong market performance. Shareholders became more confident in the board’s pay decisions and alignment between pay and performance, with significantly fewer say-on-pay failures since the pandemic highs even as total pay rose to record levels.
However, the renewed sense of normalcy may be short lived as political, regulatory, societal, and economic shifts present new potential disruptions to businesses. Compensation committees are again facing uncertain times, presenting new challenges to their job of balancing shareholder expectations with the need to properly incentivize and retain their executive talent. Changes are already occurring and there are signs of more to come.
CEO Compensation
CEO Pay Has Continued to Rise to Record Highs
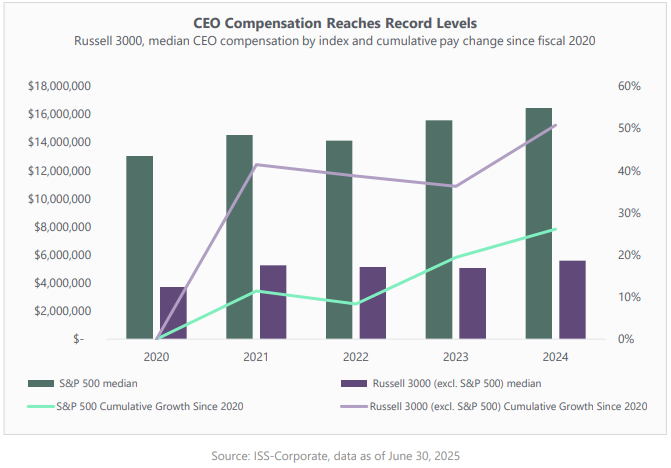
Median pay for CEOs reached all-time highs for both the S&P 500 and the rest of the Russell 3000. Over the past five years, CEO pay is up 26% in S&P 500 and 51% in Russell 3000. Growth was especially sharp in fiscal 2024, with median pay climbing 11% in the Russell 3000 to $5.6 million and 6% in the S&P 500 to $16.4 million.
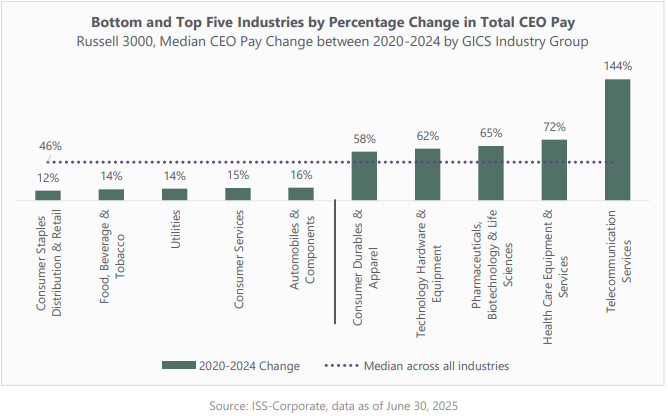
On an industry level, trends varied significantly, with some seeing sharp increases in pay while others remained mostly flat. CEO pay at Telecommunications Services has surged by 144% since 2020 to $9.4 million compared to the median pay increase of 46% across the Russell 3000 including the S&P 500. By contrast, Consumer Staples CEOs experienced the smallest pay increase: only 12% since 2020 to $9.5 million.
Incentive Pay Driving CEO Pay Increase
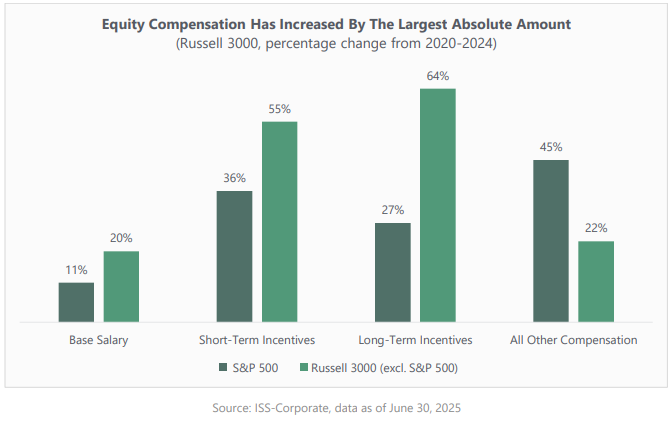
Long-term incentives (LTI) were the largest driver of the CEO pay increase, with the median LTI among S&P 500 CEOs increasing by more than 27% from $8.6 million to $11 million. Over the same period, the median LTI in the rest of the Russell 3000 increased from $2.1 million to $3.4 million. The LTI component showed the largest increase for the Russell 3000 (excluding S&P 500) in absolute terms, as well as percentage. The largest percentage increase for S&P 500 was in All Other Compensation, a broad component that contains items such as pensions and perquisites.
Increase in CEO Security Benefits Underscores Heightened Safety Concerns
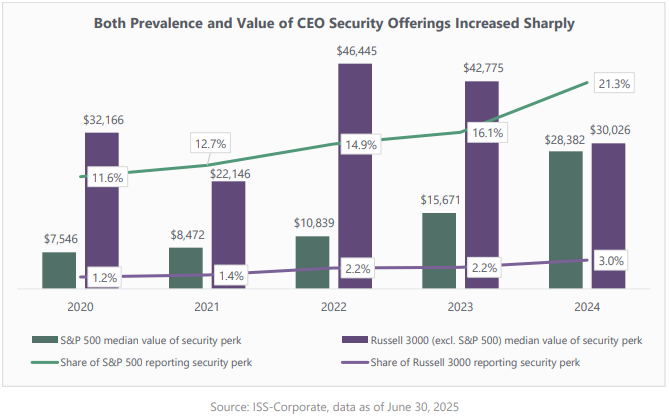
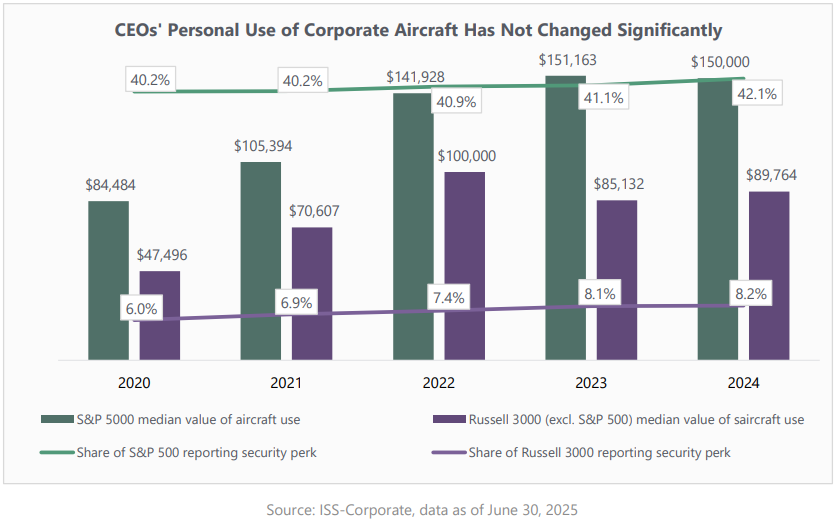
One of the most notable changes in CEO compensation this proxy season was the marked increase in both the value and prevalence of security perquisites offered to CEOs of S&P 500 companies. Since 2020, the number of S&P 500 companies disclosing CEO security benefits has nearly doubled. The value almost quadrupled over that period and close to half of that growth occurred in fiscal 2024 alone—to a median of $28,382. Across the rest of the Russell 3000 the prevalence has trebled (although this represents a modest growth from 1% to 3%), and the value has swung across a much wider range and shows a decline from a 2022 high of $46,445 to the current level of around $30,000, slightly above S&P 500 median.
Personal use of company aircraft by the CEO is often the highest value perk, often receiving scrutiny from investors and the public. However, many companies disclose aircraft use not so much as a perk but as a necessary security measure sometimes recommended by outside security consultants alongside enhanced home and personal security. However, the prevalence of these perquisites has grown only marginally: approximately 2% over the last five years for each index. The value of these perquisites also has largely plateaued since 2022.
Say-On-Pay
Support Remains Relatively Strong Despite Record CEO Pay
Despite CEO compensation climbing to record levels, median support for say-on-pay (SOP) has remained largely consistent over the last few years, with only a slight decline in 2025. During the first half of 2025, the median SOP support for S&P 500 companies was little changed from the year earlier period at 92.7%, while support for Russell 3000 companies excluding S&P 500 declined marginally to 95.2%. The number of SOP receiving less than majority support did not change materially from the 2024 count and remains significantly below levels seen between 2021 and 2023.

Off-Cycle and One-Time Compensation Decisions Continued to Decline in 2024
The decline in SOP failures is attributable at least in part to reduction in unusual, one-time compensation decisions in 2024. In the uncertain times during and after the pandemic, compensation committees exercised discretion more to retain and incentivize executives. Metric adjustments spiked in 2020 and, while changes to STI declined in 2021, adjustments to LTI remained elevated through 2021 and 2022. The decline in 2024 and 2025 of these discretionary LTI decisions coincides with fewer failed SOP votes in 2024 and 2025.

As pandemic effects receded, the use of one-time equity grants fell as well. Companies make special off-cycle grants for many reasons, including leadership transitions, new-hire agreements, for retention or to provide additional incentives. While these grants can be an important tool to retain and incentivize executives, discretionary grants that deviate from the company’s annual compensation cycle can lead to strong investor pushback. An increase in one-time equity awards following the pandemic contributed to a higher number of SOP failures in 2022 and 2023. A decline in these awards in fiscal 2023 and 2024 as well as the decline in off-cycle adjustments likely contributed to low SOP failures in 2025 despite the record-high CEO pay.

However, there is potential for an increase in mid-cycle adjustments and one-time equity grants moving forward, and that may lead to more challenging SOP votes. Policy changes and shifting priorities have already led many companies to modify their current pay designs, particularly in connection with ESG metrics. Additionally, newly imposed tariffs, swift regulatory changes, and increasing market volatility may impact the reality of reaching certain business goals and necessitate realignment of strategy and incentives.
Incentive Programs
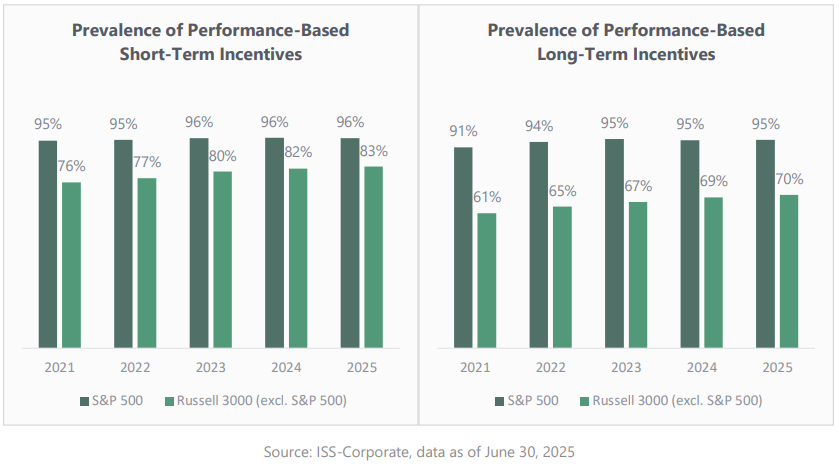
Use of Performance-based Compensation Continues to Spread
Performance-based short-term incentives (STI) and long-term incentives (LTI) have become the prevailing market practice and companies that do not provide performance-based pay are now at an all-time low. Adoption of STI and LTI among S&P 500 companies have remained stable over the years, inching up by approximately one percentage point since 2021. Use of incentive-based pay, particularly performance-based LTI, has not been as common among smaller firms outside of S&P 1500, but 56% of Russell 3000 excluding S&P 1500 now provide performance-based LTI to their CEOs, up from 54% in 2024 and 48% in 2021.
Disclosure Quality Improved for STI Programs, but Not LTI Programs
As more companies adopted performance-based pay for their CEOs, the disclosure quality of those pay programs has improved for STI programs but the same cannot be said for LTI. Since 2021, the overall quality of disclosure of STI programs among those that have adopted STI has moderately increased each year, with more companies providing complete disclosure of metric details including metric weights and target goal details for all metrics, allowing investors to fully assess the rigor of the program. However, complete disclosure of long-term incentive programs has become less common in recent years. This decline likely lies in the perception many firms have of potentially sensitive information attached to performance goals. Disclosing performance targets three years out may give insight into strategic planning or sensitive internal projections or the market and competitive landscape that may cause competitive harm to the company.

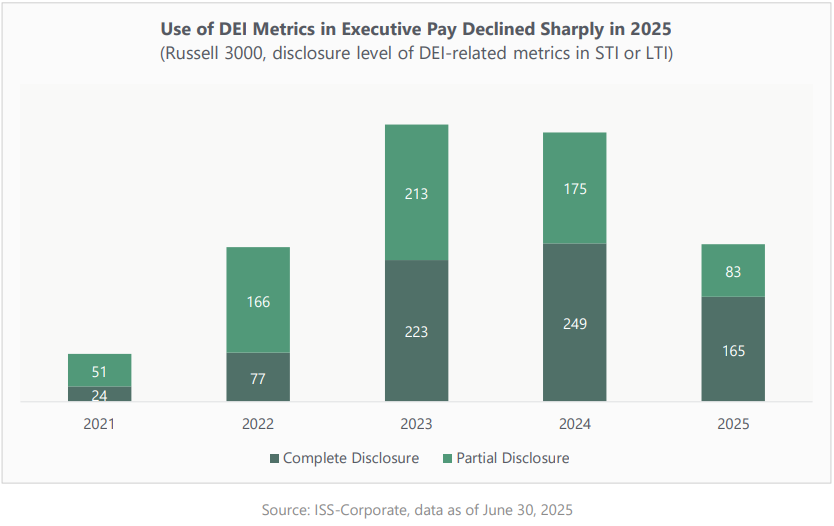
Usage of DEI and Climate Metrics Has Declined
There was a dramatic shift in the use of ESG-related metrics, particularly those with goals tied to diversity, equity, and inclusion (DEI). In the years following the pandemic, many corporations responded to heightened investor and public scrutiny of ESG by incorporating these issues into their management incentive programs. Companies implementing DEI metrics in short- or long-term incentive programs sharply increased from 2021 to 2023, but the momentum started to shift in 2024. This year saw a dramatic decrease of nearly 42%, suggesting a shift in focus for many companies as well as changes in political climate. While many companies eliminated DEI metrics altogether, some adjusted they way they disclose these metrics, using more nuanced terms such as “culture” or “belonging” instead of diversity. For the purposes of data collection and this paper, complete disclosure includes metric description, metric weight, target goal, and measured result.
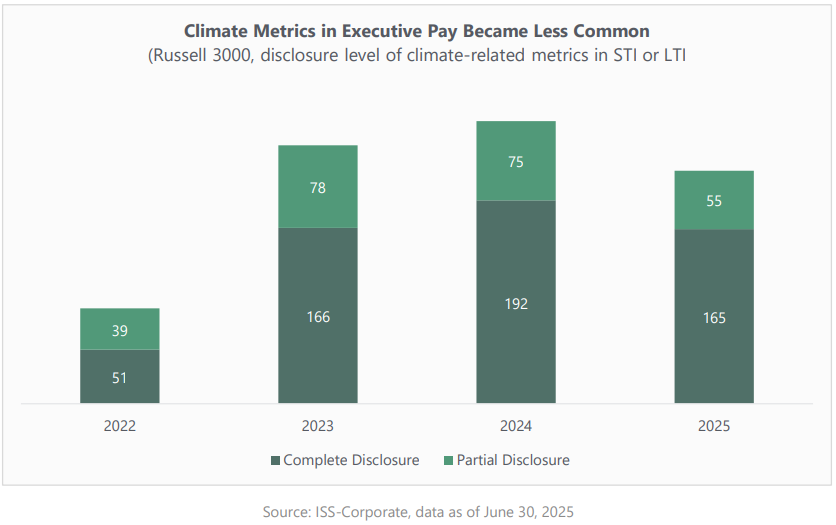
A similar, but less dramatic, story can be seen with climate-related metrics. Prevalence of these metrics increased by more than 170% from 2022 to 2023 but leveled off in 2024 and fell in 2025. These sharp declines are likely a result of political pushback and the rise of anti-ESG sentiment, causing companies to de-emphasize public commitments to avoid criticism from certain stakeholders. Furthermore, concerns regarding a potential recession and looming economic uncertainty have led companies to focus on financial performance.
Calm Before the Storm?
The strong SOP support amid record CEO pay in the 2025 proxy season underscores investor sentiment that executive pay generally is aligned with performance. Fewer one-off or discretionary pay decisions and increased usage of performance-based awards helped reinforce the perception of alignment between pay and performance. However, the relative peace many issuers have enjoyed may be short lived as increased market volatility may force compensation committees to seek greater flexibility in pay decisions, which could lead to greater shareholder scrutiny. Issuers may find history repeating itself with increased discretion and adjustments resulting in a strong shareholder rebuke as it did following the pandemic.
In such uncertain times, boards often rely on engagements with shareholders to gauge their preference and seek their input to help guide compensation decisions. However, as companies embark on shareholder outreach following their shareholder meetings, they may find that fewer investors are answering their calls. At the onset of the 2025 proxy season, the U.S. Securities & Exchange Commission (SEC) issued compliance and disclosure interpretation (C&DI) regarding rules for Schedule 13D versus Schedule 13G filings stipulating that should a shareholder recommend specific actions or condition their vote support (explicitly or implicitly) on management’s response, they could be considered to be “influencing control” over the company.
Many investors have altered their engagement approach as a result, with some opting for “listen-only” engagements, others avoiding discussions on what it would take to gain their support, and some suspending engagements altogether.
The 2025 proxy season may prove to be calm before the storm, and shareholder inputs that acted as a compass for boards to navigate turbulent waters in the past may no longer give clear direction. As boards prepare for the fall and winter shareholder outreach and the 2026 shareholder meeting, they may wish to look for other sources of information to help supplement their engagement process. Assessing investors’ past voting behavior at other companies, benchmarking of pay design and compensation governance to identify areas of potential concerns, and other salient data can clear the fog and shed light onto investors’ priorities and preferences.
Editor’s Note (February 2025): At the request of the authors, we note the following clarification regarding the compensation data presented in this post. The originally published text stated that the value of CEO security perquisites “almost quadrupled over that period and close to half of that growth occurred in fiscal 2024 alone—to a median of $28,382.” The authors have since clarified that the correct description is: “The value more than doubles over that period—to a median of $76,032.” The corresponding figure is also affected. The data point for the S&P 500 median value of security perk in 2024 should reflect $76,032, rather than the originally shown $28,382.
1For a review of governance trends, see “2025 U.S. Governance Post-Season Review: Evolving Priorities in a Shifting Landscape.”(go back)
2Incentive Benchmarking database covers over 2,400 U.S. companies, including S&P 1500.(go back)
3For the purpose of this paper, stock options are not classified as “performance-based” unless the exercise is at a meaningful premium to the market price or the vesting is conditional upon achieving performance goals.(go back)
4“2025 U.S. Proxy Season Preview: Navigating Complexity in a Changed World,” ISS-Corporate, Mar. 4, 2025(go back)